## Bar Chart: Ratio of Content Words to Function Words (R1-Llama | AMC23)
### Overview
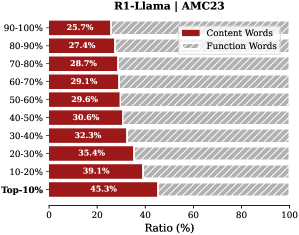
This is a horizontal bar chart displaying the ratio (in percentage) of content words to function words, categorized by frequency ranges. The chart is titled "R1-Llama | AMC23". The x-axis represents the ratio in percentage, ranging from 0 to 100. The y-axis represents frequency ranges, from "Top 10%" to "90-100%".
### Components/Axes
* **Title:** R1-Llama | AMC23 (top-center)
* **X-axis Label:** Ratio (%) (bottom-center)
* **Y-axis Labels:**
* Top 10%
* 10-20%
* 20-30%
* 30-40%
* 40-50%
* 50-60%
* 60-70%
* 70-80%
* 80-90%
* 90-100%
* **Legend:**
* Content Words (dark red)
* Function Words (light gray)
### Detailed Analysis
The chart consists of ten horizontal bars, each representing a frequency range. Each bar is divided into two sections: a dark red section representing the "Content Words" ratio and a light gray section representing the "Function Words" ratio.
Here's a breakdown of the data points, reading from the bottom up:
* **Top 10%:** Content Words: 45.3%, Function Words: approximately 54.7% (total 100%)
* **10-20%:** Content Words: 39.1%, Function Words: approximately 60.9%
* **20-30%:** Content Words: 35.4%, Function Words: approximately 64.6%
* **30-40%:** Content Words: 32.3%, Function Words: approximately 67.7%
* **40-50%:** Content Words: 30.6%, Function Words: approximately 69.4%
* **50-60%:** Content Words: 29.6%, Function Words: approximately 70.4%
* **60-70%:** Content Words: 29.1%, Function Words: approximately 70.9%
* **70-80%:** Content Words: 28.7%, Function Words: approximately 71.3%
* **80-90%:** Content Words: 27.4%, Function Words: approximately 72.6%
* **90-100%:** Content Words: 25.7%, Function Words: approximately 74.3%
The "Content Words" ratio generally decreases as the frequency range increases, while the "Function Words" ratio increases.
### Key Observations
* The ratio of content words is highest in the "Top 10%" frequency range (45.3%).
* The ratio of content words is lowest in the "90-100%" frequency range (25.7%).
* There is a consistent, downward trend in the content word ratio as the frequency range increases.
* The function word ratio consistently increases as the frequency range increases.
### Interpretation
The chart demonstrates an inverse relationship between word frequency and the proportion of content words. More frequent words (those appearing in the 90-100% range) are more likely to be function words (articles, prepositions, conjunctions, etc.), while less frequent words (those in the top 10%) are more likely to be content words (nouns, verbs, adjectives, etc.). This is expected, as function words provide grammatical structure and are used repeatedly, while content words carry the primary meaning and are more diverse.
The data suggests that the language model (R1-Llama) or the corpus (AMC23) exhibits a typical distribution of word frequencies, where a small number of words account for a large proportion of the total word count, and these are predominantly function words. This information could be useful for optimizing language models, improving text compression, or analyzing linguistic characteristics of the corpus. The consistent trend indicates a robust pattern rather than random variation.