\n
## Bar Charts: Qwen Model Accuracy Comparison
### Overview
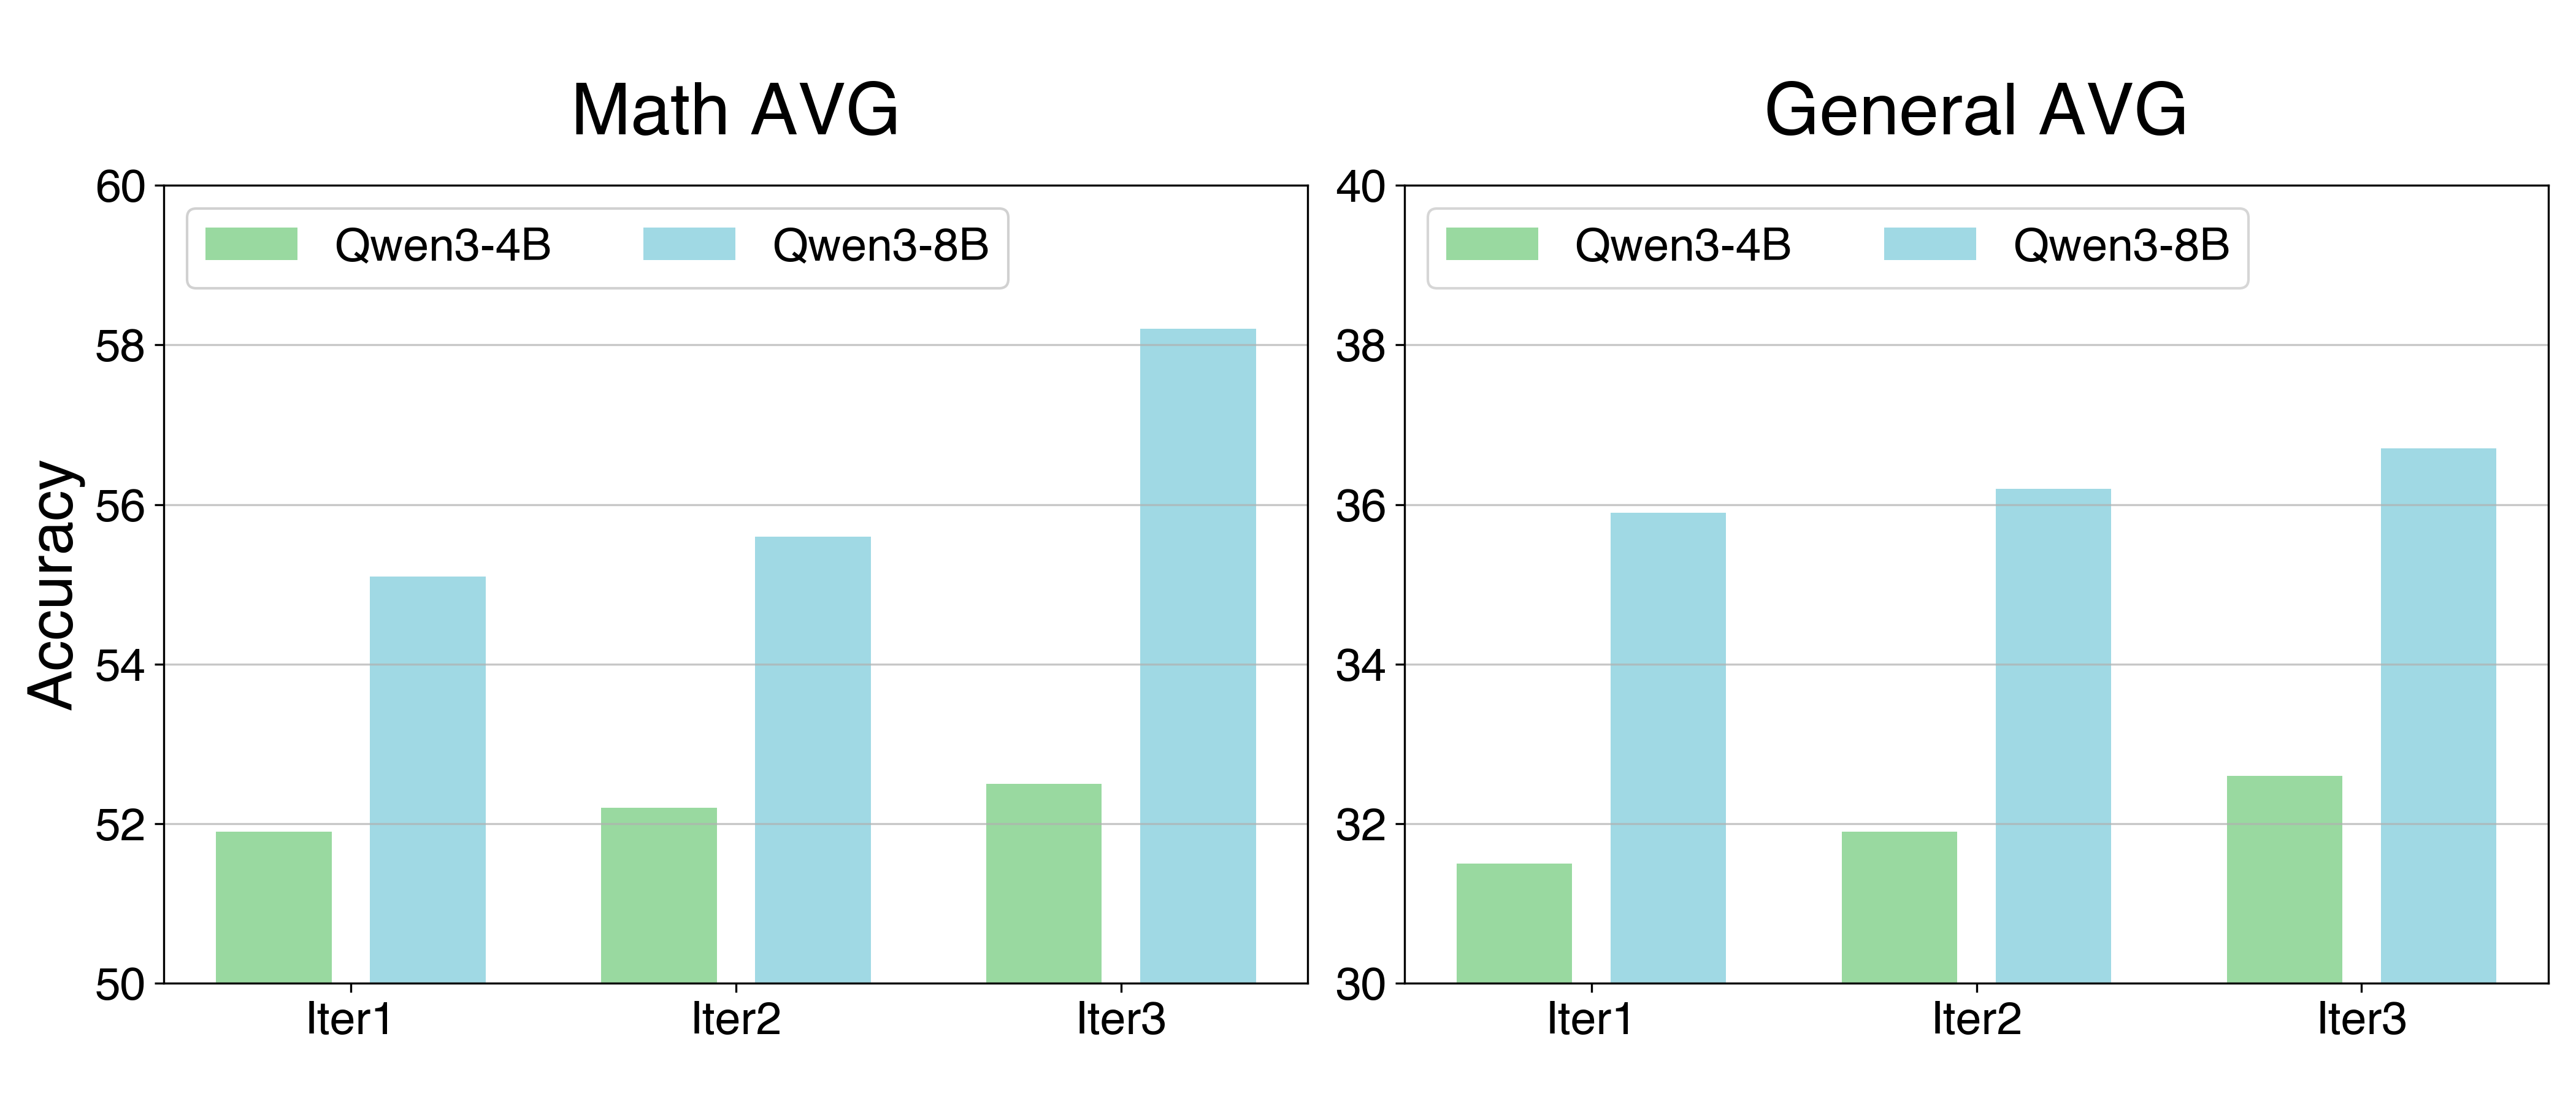
The image presents two bar charts comparing the accuracy of two Qwen language models (Qwen3-4B and Qwen3-8B) across three iterations (Iter1, Iter2, Iter3). The first chart focuses on "Math AVG" accuracy, while the second focuses on "General AVG" accuracy.
### Components/Axes
Both charts share the following components:
* **X-axis:** Iteration number (Iter1, Iter2, Iter3).
* **Y-axis:** Accuracy, with scales ranging from 50 to 60 for the "Math AVG" chart and 30 to 40 for the "General AVG" chart.
* **Legend:**
* Qwen3-4B (represented by a light green color)
* Qwen3-8B (represented by a light blue color)
### Detailed Analysis or Content Details
**Chart 1: Math AVG**
* **Qwen3-4B:**
* Iter1: Approximately 51.5 accuracy.
* Iter2: Approximately 52.2 accuracy.
* Iter3: Approximately 52.4 accuracy.
* Trend: The Qwen3-4B line shows a slight upward trend, but the increase in accuracy is minimal.
* **Qwen3-8B:**
* Iter1: Approximately 55.2 accuracy.
* Iter2: Approximately 55.8 accuracy.
* Iter3: Approximately 58.8 accuracy.
* Trend: The Qwen3-8B line shows a clear upward trend, with a significant increase in accuracy from Iter1 to Iter3.
**Chart 2: General AVG**
* **Qwen3-4B:**
* Iter1: Approximately 31.5 accuracy.
* Iter2: Approximately 32.2 accuracy.
* Iter3: Approximately 32.5 accuracy.
* Trend: The Qwen3-4B line shows a slight upward trend, but the increase in accuracy is minimal.
* **Qwen3-8B:**
* Iter1: Approximately 35.8 accuracy.
* Iter2: Approximately 36.2 accuracy.
* Iter3: Approximately 36.5 accuracy.
* Trend: The Qwen3-8B line shows a slight upward trend, but the increase in accuracy is minimal.
### Key Observations
* In both charts, Qwen3-8B consistently outperforms Qwen3-4B across all iterations.
* The accuracy improvement for Qwen3-8B is more pronounced in the "Math AVG" chart, particularly from Iter2 to Iter3.
* The accuracy gains across iterations are relatively small for both models in the "General AVG" chart.
* The gap between the two models is larger in the "Math AVG" chart than in the "General AVG" chart.
### Interpretation
The data suggests that the Qwen3-8B model is more capable than the Qwen3-4B model, especially in mathematical tasks. The consistent upward trend for Qwen3-8B in both charts indicates that further iterations may lead to continued improvements in accuracy. The smaller gains observed in the "General AVG" chart might suggest that the models are approaching a performance ceiling on general tasks, or that the improvements are less noticeable due to the broader nature of the evaluation. The larger performance difference in the "Math AVG" chart could indicate that the 8B model benefits more from increased parameters when tackling more complex, structured tasks like mathematics. The relatively small accuracy differences between iterations suggest diminishing returns, and future development efforts might focus on architectural improvements rather than simply increasing model size.