## Bar Charts: Model Accuracy Comparison Across Iterations
### Overview
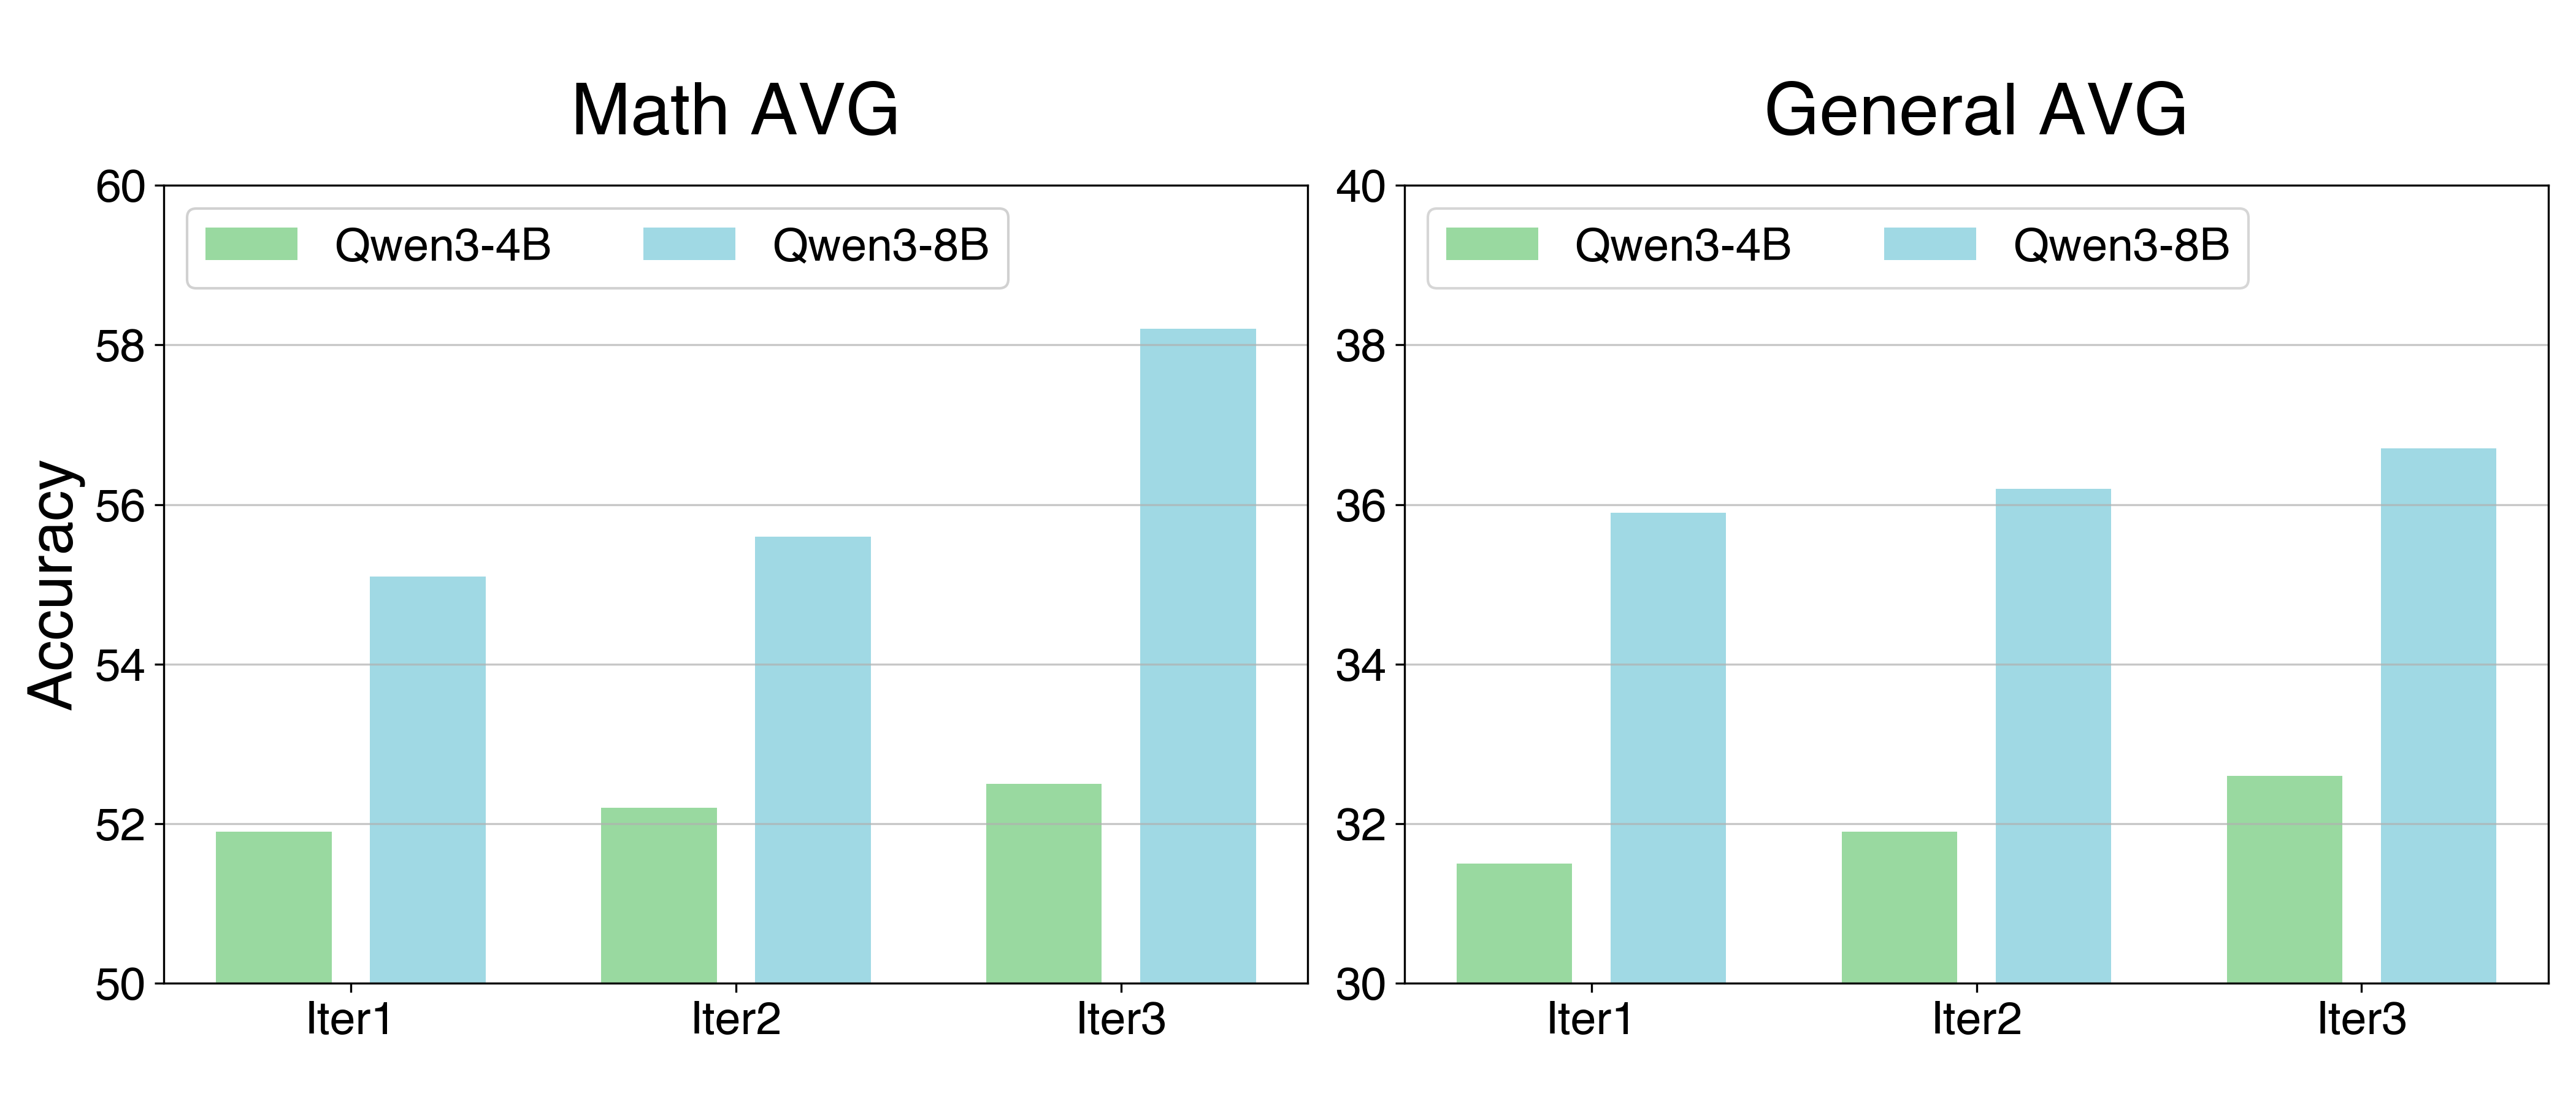
The image displays two side-by-side bar charts comparing the accuracy of two AI models, Qwen3-4B and Qwen3-8B, across three training iterations (Iter1, Iter2, Iter3). The left chart is titled "Math AVG" (Mathematics Average), and the right chart is titled "General AVG" (General Average). Both charts measure "Accuracy" on the y-axis, but with different scales.
### Components/Axes
**Common Elements:**
* **X-Axis (Both Charts):** Labeled with categorical markers: `Iter1`, `Iter2`, `Iter3`.
* **Y-Axis (Both Charts):** Labeled `Accuracy`.
* **Legend (Top-Left of each chart):**
* Green bar: `Qwen3-4B`
* Light blue bar: `Qwen3-8B`
**Left Chart - "Math AVG":**
* **Title:** `Math AVG`
* **Y-Axis Scale:** Ranges from 50 to 60, with major gridlines at intervals of 2 (50, 52, 54, 56, 58, 60).
**Right Chart - "General AVG":**
* **Title:** `General AVG`
* **Y-Axis Scale:** Ranges from 30 to 40, with major gridlines at intervals of 2 (30, 32, 34, 36, 38, 40).
### Detailed Analysis
**Data Points (Approximate Values):**
**Chart 1: Math AVG**
| Iteration | Qwen3-4B (Green) Accuracy | Qwen3-8B (Light Blue) Accuracy |
| :--- | :--- | :--- |
| Iter1 | ~51.9 | ~55.1 |
| Iter2 | ~52.2 | ~55.6 |
| Iter3 | ~52.5 | ~58.2 |
**Chart 2: General AVG**
| Iteration | Qwen3-4B (Green) Accuracy | Qwen3-8B (Light Blue) Accuracy |
| :--- | :--- | :--- |
| Iter1 | ~31.5 | ~35.9 |
| Iter2 | ~31.9 | ~36.2 |
| Iter3 | ~32.6 | ~36.7 |
**Trend Verification:**
* **Qwen3-4B (Green):** In both charts, the green bars show a slight but consistent upward trend from Iter1 to Iter3.
* **Qwen3-8B (Light Blue):** In both charts, the light blue bars show a clear upward trend from Iter1 to Iter3, with a more pronounced increase in the "Math AVG" chart between Iter2 and Iter3.
### Key Observations
1. **Model Performance Gap:** The Qwen3-8B model consistently achieves higher accuracy than the Qwen3-4B model across all iterations in both the Math and General categories.
2. **Domain Difference:** The absolute accuracy scores are significantly higher in the "Math AVG" chart (50-60 range) compared to the "General AVG" chart (30-40 range), suggesting the models perform better on the evaluated math tasks than on the general tasks.
3. **Improvement Rate:** The larger model (Qwen3-8B) shows a greater absolute improvement over the three iterations, especially in the Math domain where its accuracy increases by approximately 3.1 points (from ~55.1 to ~58.2). The smaller model's improvement is more modest (~0.6 points in Math, ~1.1 points in General).
4. **Iteration Consistency:** Both models show monotonic improvement (accuracy increases with each iteration) in both task categories.
### Interpretation
The data demonstrates a clear positive correlation between model size (parameter count) and task performance, with the 8-billion parameter model outperforming the 4-billion parameter model. This advantage is present from the first iteration and is maintained or grows through subsequent training iterations.
The consistent improvement across iterations for both models indicates that the training or refinement process is effective. The more substantial gains for the larger model, particularly in mathematics, suggest it may have a greater capacity to absorb and leverage additional training data or optimization steps.
The stark difference in accuracy ranges between "Math AVG" and "General AVG" implies that the benchmark tasks used for evaluation are not of equal difficulty, or that these specific models are inherently stronger in mathematical reasoning compared to the broader set of skills measured by the "General" benchmark. The charts effectively communicate that iterative training benefits both models, but the larger model capitalizes on it more effectively, especially in its area of relative strength (math).