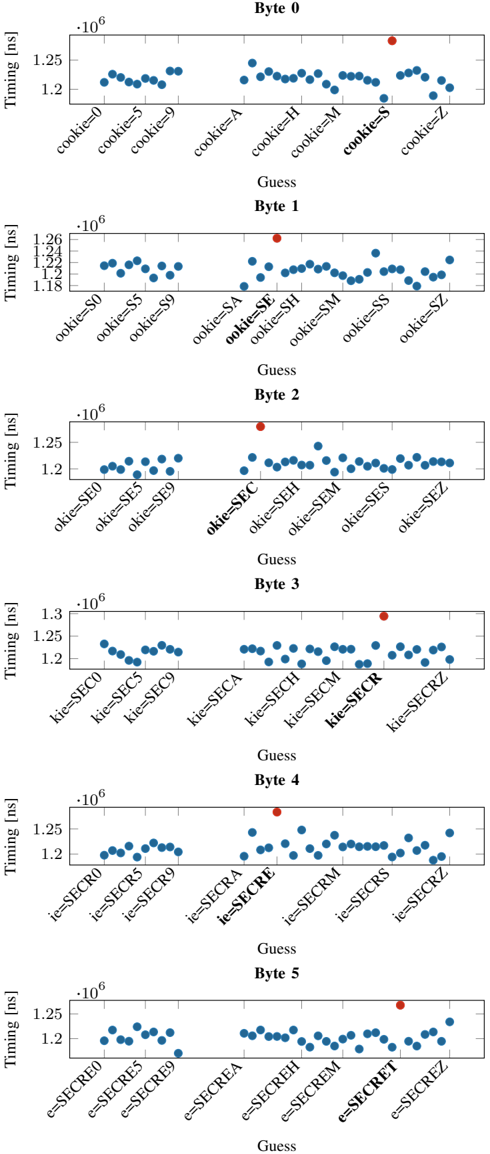
## Line Charts: Timing Analysis Across Bytes 0-5
### Overview
The image contains six horizontal line charts, each labeled "Byte 0" to "Byte 5". Each chart plots "Timing [ns]" on the y-axis (ranging from 1.2 × 10⁶ to 1.25 × 10⁶ ns) against categorical labels on the x-axis. A legend distinguishes two data series: "Guess" (red) and "cookie=SE" (red, but with distinct labels). Blue data points dominate, with red outliers marked as "Guess".
### Components/Axes
- **Y-axis**: "Timing [ns]" (1.2 × 10⁶ to 1.25 × 10⁶ ns, with gridlines at 1.2, 1.22, 1.24, 1.25 × 10⁶).
- **X-axis**: Categorical labels vary per byte:
- **Byte 0**: `cookie=0`, `cookie=5`, `cookie=9`, `cookie=A`, `cookie=H`, `cookie=M`, `cookie=S`, `cookie=Z`.
- **Byte 1**: `ookie=S0`, `ookie=S5`, `ookie=S9`, `ookie=SA`, `ookie=SE`, `ookie=SH`, `ookie=SM`, `ookie=SS`, `ookie=SZ`.
- **Byte 2**: `okie=SE0`, `okie=SE5`, `okie=SE9`, `okie=SEA`, `okie=SEC`, `okie=SEH`, `okie=SEM`, `okie=SES`, `okie=SEZ`.
- **Byte 3**: `kie=SEC0`, `kie=SEC5`, `kie=SEC9`, `kie=SECA`, `kie=SECH`, `kie=SECM`, `kie=SECR`, `kie=SECRZ`.
- **Byte 4**: `ie=SECR0`, `ie=SECR5`, `ie=SECR9`, `ie=SECRS`, `ie=SECRZ`.
- **Byte 5**: `e=SECRE0`, `e=SECRE5`, `e=SECRE9`, `e=SECREA`, `e=SECREH`, `e=SECREM`, `e=SECRET`, `e=SECREZ`.
- **Legend**: Located at the top of each chart.
- **Blue**: "Guess" (data points).
- **Red**: "cookie=SE" (labels, not data points).
### Detailed Analysis
- **Byte 0**:
- Blue points cluster around 1.2 × 10⁶ ns, with minor fluctuations (e.g., 1.21–1.22 × 10⁶ ns).
- Red "Guess" point at 1.25 × 10⁶ ns (highest value).
- **Byte 1**:
- Blue points range from 1.18 × 10⁶ to 1.24 × 10⁶ ns.
- Red "Guess" point at 1.24 × 10⁶ ns.
- **Byte 2**:
- Blue points cluster tightly around 1.2 × 10⁶ ns.
- Red "Guess" point at 1.25 × 10⁶ ns.
- **Byte 3**:
- Blue points range from 1.2 × 10⁶ to 1.22 × 10⁶ ns.
- Red "Guess" point at 1.25 × 10⁶ ns.
- **Byte 4**:
- Blue points cluster around 1.2 × 10⁶ ns.
- Red "Guess" point at 1.25 × 10⁶ ns.
- **Byte 5**:
- Blue points range from 1.2 × 10⁶ to 1.22 × 10⁶ ns.
- Red "Guess" point at 1.25 × 10⁶ ns.
### Key Observations
1. **Consistent Outliers**: The red "Guess" points (1.25 × 10⁶ ns) are consistently higher than all blue data points (1.2–1.24 × 10⁶ ns) across all bytes.
2. **Clustered Blue Data**: Blue points show minimal variation, suggesting stable timing for non-"Guess" categories.
3. **Label Patterns**: X-axis labels follow a prefix-suffix structure (e.g., `cookie=`, `ookie=`, `okie=`, `kie=`, `ie=`, `e=`) with suffixes like `0`, `5`, `9`, `A`, `H`, `M`, `S`, `Z`, and combinations (e.g., `SE`, `SM`, `SECR`).
### Interpretation
- **Timing Discrepancy**: The "Guess" category (red) consistently exhibits higher timing than other categories, implying it may involve more computational overhead or a different algorithmic path.
- **Label Structure**: The x-axis labels suggest a hierarchical or categorical grouping (e.g., `cookie=`, `ookie=`, `okie=`) with subcategories (e.g., `SE`, `SM`, `SECR`). This could represent different test cases, configurations, or data segments.
- **Anomaly Significance**: The red "Guess" points may indicate a specific scenario (e.g., a fallback mechanism, error handling, or optimization test) that is slower than standard operations.
- **Data Integrity**: The legend’s "cookie=SE" label (red) does not correspond to any data points, suggesting it might be a mislabeling or a placeholder for a different category.
### Spatial Grounding
- **Legend Position**: Top of each chart, aligned horizontally.
- **Data Points**: Blue points are evenly distributed along the x-axis, with red "Guess" points positioned at the far right of each chart.
- **Axis Alignment**: Y-axis values are consistent across all charts, ensuring comparability.
### Content Details
- **Numerical Values**:
- Blue points: 1.2–1.24 × 10⁶ ns (with minor fluctuations).
- Red "Guess" points: 1.24–1.25 × 10⁶ ns.
- **Label Counts**:
- Byte 0: 8 labels.
- Byte 1: 9 labels.
- Byte 2: 9 labels.
- Byte 3: 8 labels.
- Byte 4: 5 labels.
- Byte 5: 8 labels.
### Final Notes
The charts highlight a systematic difference in timing between the "Guess" and other categories, with the latter showing stability. The red "Guess" points may represent a critical or edge-case scenario requiring further investigation. The x-axis labels suggest a structured categorization, but the legend’s "cookie=SE" label requires clarification to avoid misinterpretation.