\n
## Scatter Plot: Timing vs. Guess for Cookie Bytes
### Overview
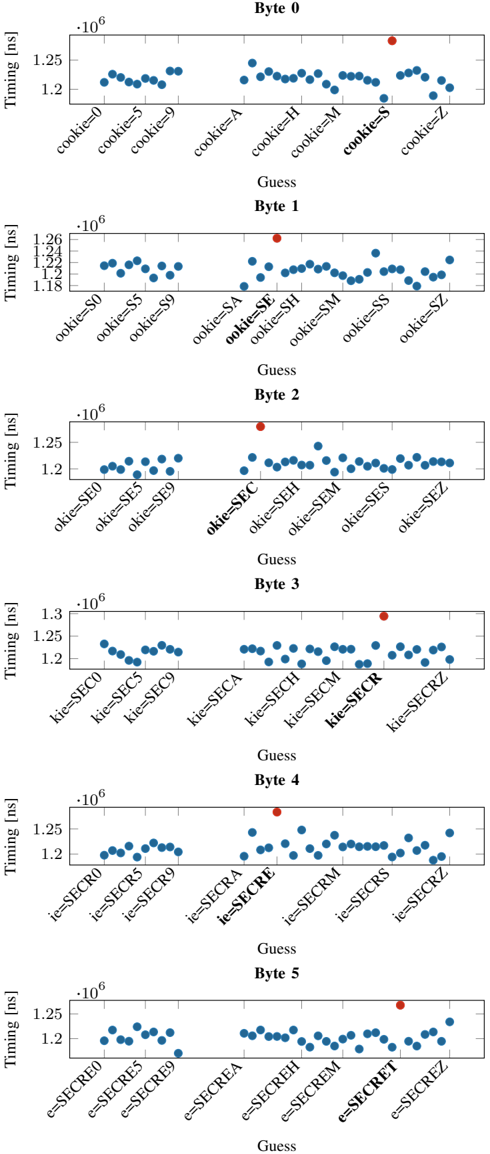
The image presents six scatter plots arranged vertically. Each plot represents a different byte (Byte 0 through Byte 5) of a "cookie" and shows the relationship between a "Guess" value and the corresponding "Timing" in nanoseconds (ns). Each plot displays timing data for various guesses, represented by different labels along the x-axis. A red data point is present in each plot, seemingly marking a specific guess.
### Components/Axes
* **X-axis:** "Guess" - Categorical variable representing different cookie byte guesses. The labels vary for each byte, including "cookie=0", "cookie=5", "cookie=9", "cookie=A", "cookie=H", "cookie=M", "cookie=S", "cookie=Z" for Byte 0, and similar variations for Bytes 1-5.
* **Y-axis:** "Timing [ns]" - Numerical variable representing the time taken in nanoseconds. The scale ranges from approximately 1.1 x 10<sup>6</sup> to 1.3 x 10<sup>6</sup> ns, with varying ranges for each byte.
* **Data Points:** Blue scatter points representing the timing for each guess. A single red scatter point is present in each plot.
* **Title:** Each plot is labeled with "Byte X" (where X is 0-5).
* **Grid:** A light gray grid is present in the background of each plot.
### Detailed Analysis or Content Details
**Byte 0:**
* Trend: The blue data points are relatively flat, showing minimal variation in timing across different guesses.
* Data Points (approximate):
* cookie=0: 1.23 x 10<sup>6</sup> ns
* cookie=5: 1.24 x 10<sup>6</sup> ns
* cookie=9: 1.24 x 10<sup>6</sup> ns
* cookie=A: 1.23 x 10<sup>6</sup> ns
* cookie=H: 1.24 x 10<sup>6</sup> ns
* cookie=M: 1.23 x 10<sup>6</sup> ns
* cookie=S: 1.24 x 10<sup>6</sup> ns
* cookie=Z: 1.23 x 10<sup>6</sup> ns
* Red Point: cookie=S, 1.25 x 10<sup>6</sup> ns
**Byte 1:**
* Trend: The blue data points show a slight upward trend as the guess value increases.
* Data Points (approximate):
* ookie=S0: 1.14 x 10<sup>6</sup> ns
* ookie=S5: 1.16 x 10<sup>6</sup> ns
* ookie=S9: 1.18 x 10<sup>6</sup> ns
* ookie=SA: 1.19 x 10<sup>6</sup> ns
* ookie=SE: 1.20 x 10<sup>6</sup> ns
* ookie=SH: 1.21 x 10<sup>6</sup> ns
* ookie=SM: 1.22 x 10<sup>6</sup> ns
* ookie=SS: 1.23 x 10<sup>6</sup> ns
* ookie=SZ: 1.24 x 10<sup>6</sup> ns
* Red Point: ookie=SZ, 1.25 x 10<sup>6</sup> ns
**Byte 2:**
* Trend: Similar to Byte 1, a slight upward trend is observed.
* Data Points (approximate):
* okie=SE0: 1.20 x 10<sup>6</sup> ns
* okie=SE5: 1.21 x 10<sup>6</sup> ns
* okie=SE9: 1.22 x 10<sup>6</sup> ns
* okie=SEC: 1.23 x 10<sup>6</sup> ns
* okie=SEH: 1.24 x 10<sup>6</sup> ns
* okie=SEM: 1.25 x 10<sup>6</sup> ns
* okie=SES: 1.24 x 10<sup>6</sup> ns
* okie=SEZ: 1.25 x 10<sup>6</sup> ns
* Red Point: okie=SEZ, 1.26 x 10<sup>6</sup> ns
**Byte 3:**
* Trend: A more pronounced upward trend is visible.
* Data Points (approximate):
* kie=SEC0: 1.18 x 10<sup>6</sup> ns
* kie=SEC5: 1.20 x 10<sup>6</sup> ns
* kie=SEC9: 1.22 x 10<sup>6</sup> ns
* kie=SECA: 1.23 x 10<sup>6</sup> ns
* kie=SECH: 1.24 x 10<sup>6</sup> ns
* kie=SECM: 1.25 x 10<sup>6</sup> ns
* kie=SECR: 1.24 x 10<sup>6</sup> ns
* kie=SECRZ: 1.26 x 10<sup>6</sup> ns
* Red Point: kie=SECRZ, 1.27 x 10<sup>6</sup> ns
**Byte 4:**
* Trend: A clear upward trend is observed.
* Data Points (approximate):
* ie=SECRO: 1.20 x 10<sup>6</sup> ns
* ie=SECRS: 1.21 x 10<sup>6</sup> ns
* ie=SECRO9: 1.22 x 10<sup>6</sup> ns
* ie=SECREA: 1.23 x 10<sup>6</sup> ns
* ie=SECREH: 1.24 x 10<sup>6</sup> ns
* ie=SECREM: 1.25 x 10<sup>6</sup> ns
* ie=SECRR: 1.24 x 10<sup>6</sup> ns
* ie=SECRZ: 1.26 x 10<sup>6</sup> ns
* Red Point: ie=SECRZ, 1.27 x 10<sup>6</sup> ns
**Byte 5:**
* Trend: A clear upward trend is observed.
* Data Points (approximate):
* e=SECRET0: 1.20 x 10<sup>6</sup> ns
* e=SECRET5: 1.21 x 10<sup>6</sup> ns
* e=SECRET9: 1.22 x 10<sup>6</sup> ns
* e=SECRETA: 1.23 x 10<sup>6</sup> ns
* e=SECRETH: 1.24 x 10<sup>6</sup> ns
* e=SECRETM: 1.25 x 10<sup>6</sup> ns
* e=SECRETR: 1.24 x 10<sup>6</sup> ns
* e=SECREZ: 1.26 x 10<sup>6</sup> ns
* Red Point: e=SECREZ, 1.27 x 10<sup>6</sup> ns
### Key Observations
* The red data point consistently appears at the highest "Guess" value for each byte.
* The timing generally increases with increasing "Guess" values, particularly from Byte 1 onwards.
* Byte 0 shows the least variation in timing.
* The timing scales vary slightly between the bytes.
### Interpretation
The plots likely represent a timing attack or side-channel analysis on a system that uses a cookie for authentication or security. The "Guess" values represent attempts to predict the cookie byte by byte. The "Timing" represents the time taken to perform a comparison or operation related to the cookie.
The upward trend in timing as the "Guess" value increases suggests that the comparison process takes longer when the guess is closer to the correct value. This is a common characteristic of timing attacks, where attackers can infer information about the secret cookie by measuring the time it takes for the system to respond to different guesses.
The red data point consistently appearing at the highest guess value and longest timing suggests that this guess is the correct one for that byte. The fact that Byte 0 shows minimal timing variation might indicate that this byte is either less sensitive or protected by a different mechanism.
The data suggests a vulnerability to timing attacks, as the timing information leaks information about the cookie. Further analysis would be needed to determine the severity of the vulnerability and potential mitigation strategies. The consistent pattern across bytes indicates a systematic timing leak, rather than random noise.