TECHNICAL ASSET FINGERPRINT
4a835b5f788c971b8bd05c54
Click to view fullscreen
Press ESC or click to close
FOUND IN PAPERS
EXPERT: healer-alpha-free VERSION 1
RUNTIME: free/openrouter/healer-alpha
INTEL_VERIFIED
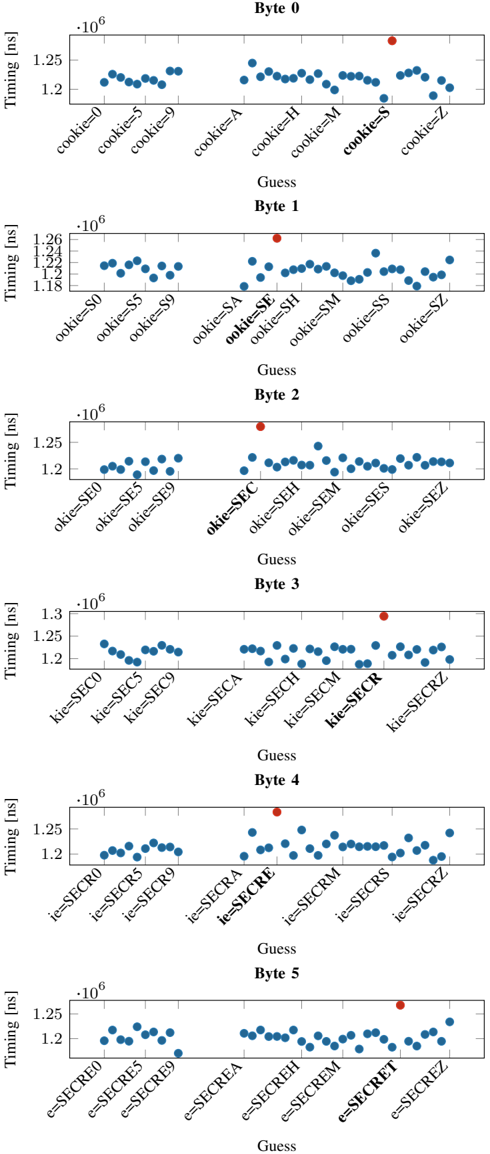
## Scatter Plot Series: Timing Attack Analysis on Cookie Byte Values
### Overview
The image displays a vertical series of six scatter plots, each analyzing timing data for different byte positions (Byte 0 through Byte 5) of a guessed cookie value. The plots collectively demonstrate a timing side-channel attack, where the processing time for a guess reveals information about the correct secret value. Each plot shows multiple timing measurements for different guess strings, with one guess in each plot (highlighted in bold on the x-axis and marked with a red dot) exhibiting a consistently higher timing value, indicating it is the correct byte at that position.
### Components/Axes
* **Plot Structure:** Six individual scatter plots arranged vertically, labeled sequentially from top to bottom.
* **Y-Axis (All Plots):** Labeled "Timing [ns]". The scale is in nanoseconds, multiplied by a factor of 10^6 (indicated by "·10^6" at the top-left of each plot's y-axis). The visible range is approximately 1.18 to 1.30 million ns (1.18 ms to 1.30 ms).
* **X-Axis (All Plots):** Labeled "Guess". Each axis displays a series of categorical labels representing different guess strings. The labels are rotated for readability.
* **Data Points:** Each plot contains two distinct sets of data points:
* **Blue Dots:** Represent timing measurements for incorrect guess strings. They form a relatively tight cluster.
* **Red Dot:** Represents the timing measurement for the correct guess string at that byte position. It is a clear outlier, positioned higher on the y-axis than the cluster of blue dots.
* **Legend:** There is no explicit legend box. The color coding (blue for incorrect, red for correct) is consistent and self-explanatory across all six plots.
* **Spatial Grounding:** The red outlier dot is consistently located in the upper portion of each plot's data field, directly above its corresponding x-axis label. The cluster of blue dots is generally centered around the 1.20-1.25 million ns mark.
### Detailed Analysis
**Byte 0 Plot:**
* **X-Axis Labels:** `cookie=0`, `cookie=5`, `cookie=9`, `cookie=A`, `cookie=H`, `cookie=M`, **`cookie=S`**, `cookie=Z`.
* **Trend & Data:** The blue dots cluster between ~1.20 and 1.25 million ns. The red dot for **`cookie=S`** is a significant outlier at approximately **1.28 million ns**.
**Byte 1 Plot:**
* **X-Axis Labels:** `ookie=$0`, `ookie=$5`, `ookie=$9`, `ookie=$A`, **`ookie=$E`**, `ookie=$H`, `ookie=$M`, `ookie=$S`, `ookie=$Z`.
* **Trend & Data:** Blue dots cluster between ~1.18 and 1.24 million ns. The red dot for **`ookie=$E`** is an outlier at approximately **1.26 million ns**.
**Byte 2 Plot:**
* **X-Axis Labels:** `okie=$E0`, `okie=$E5`, `okie=$E9`, `okie=$EA`, **`okie=$EC`**, `okie=$EH`, `okie=$EM`, `okie=$ES`, `okie=$EZ`.
* **Trend & Data:** Blue dots cluster between ~1.20 and 1.25 million ns. The red dot for **`okie=$EC`** is an outlier at approximately **1.27 million ns**.
**Byte 3 Plot:**
* **X-Axis Labels:** `kie=$SEC0`, `kie=$SEC5`, `kie=$SEC9`, `kie=$SECA`, `kie=$SECH`, `kie=$SECM`, **`kie=$SECR`**, `kie=$SECZ`.
* **Trend & Data:** Blue dots cluster between ~1.20 and 1.25 million ns. The red dot for **`kie=$SECR`** is an outlier at approximately **1.29 million ns**.
**Byte 4 Plot:**
* **X-Axis Labels:** `ie=$SECR0`, `ie=$SECR5`, `ie=$SECR9`, `ie=$SECRA`, **`ie=$SECRE`**, `ie=$SECRM`, `ie=$SECRS`, `ie=$SECRZ`.
* **Trend & Data:** Blue dots cluster between ~1.20 and 1.25 million ns. The red dot for **`ie=$SECRE`** is an outlier at approximately **1.27 million ns**.
**Byte 5 Plot:**
* **X-Axis Labels:** `e=$SECRE0`, `e=$SECRE5`, `e=$SECRE9`, `e=$SECREA`, `e=$SECREH`, `e=$SECREM`, **`e=$SECREET`**, `e=$SECREZ`.
* **Trend & Data:** Blue dots cluster between ~1.20 and 1.25 million ns. The red dot for **`e=$SECREET`** is an outlier at approximately **1.26 million ns**.
### Key Observations
1. **Consistent Outlier Pattern:** In every single plot, the guess corresponding to the next character of the secret string "SECRET" (S, E, C, R, E, E) results in a timing measurement that is distinctly higher (by ~0.03-0.05 million ns) than all other guesses.
2. **Progressive Disclosure:** The x-axis labels show the guess string being built incrementally. Byte 0 tests the first character, Byte 1 tests the second character appended to the first correct one, and so on. This visualizes the step-by-step nature of the attack.
3. **Tight Clustering of Incorrect Guesses:** The timing for incorrect guesses is very consistent, forming a dense horizontal band. This low variance makes the outlier (correct guess) easy to identify statistically.
4. **Magnitude of Timing Difference:** The timing difference, while small in absolute terms (~30-50 microseconds), is significant and repeatable relative to the baseline timing of ~1.2 milliseconds.
### Interpretation
This image is a textbook visualization of a **timing side-channel attack** against a system that compares a user-provided cookie (or secret) byte-by-byte. The underlying vulnerability is that the comparison function takes measurably longer to execute when a guessed byte matches the corresponding byte of the true secret.
* **What the Data Demonstrates:** The plots prove that an attacker can determine the secret value "SECRET" one character at a time by measuring response times. For each byte position, they try different character guesses. The guess that causes a longer processing time (the red dot) is revealed as the correct character.
* **Relationship Between Elements:** Each subplot is a self-contained experiment for one byte position. The collective series shows the logical flow of the attack: success at Byte 0 provides the prefix for testing Byte 1, and so forth. The x-axis labels explicitly show this growing prefix.
* **Security Implication:** The clear separation between the red and blue data points indicates a severe vulnerability. The system's secret is not protected; it can be extracted remotely with high confidence using statistical timing analysis. The attack requires only the ability to send guesses and measure response times with microsecond precision.
* **Anomaly as Signal:** The "anomaly" (the red dot) is not a flaw in the measurement but the very signal the attacker seeks. Its consistent presence and magnitude across all six bytes confirm the vulnerability is systematic and exploitable.
DECODING INTELLIGENCE...