# Technical Document Extraction
## Chart Description
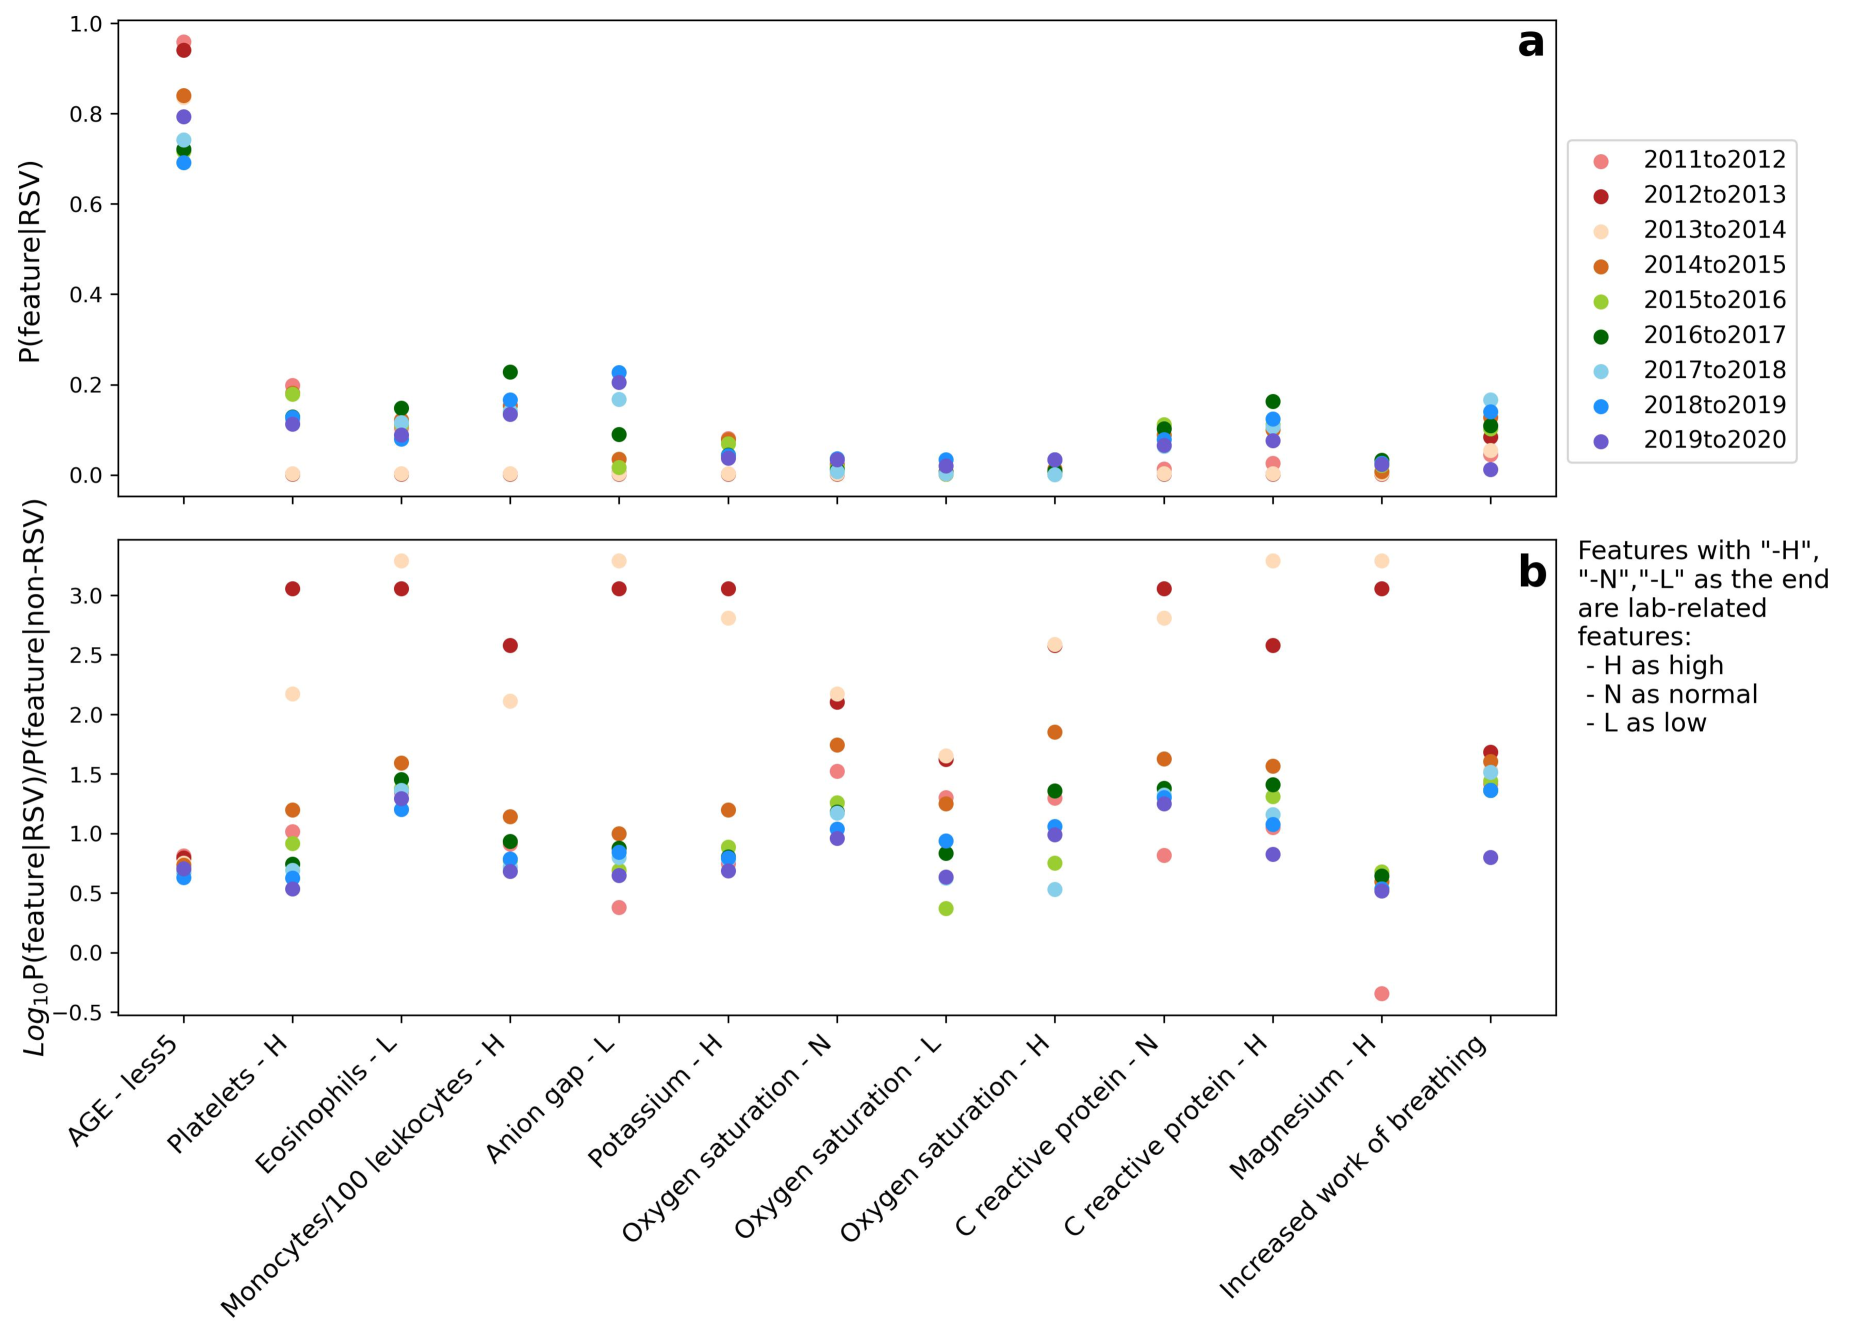
The image contains two scatter plots (subplots **a** and **b**) analyzing feature probabilities related to RSV (Respiratory Syncytial Virus) across different years and biological features. Both plots use color-coded data points to represent temporal and categorical trends.
---
### **Subplot a: P(feature|RSV) Over Time**
#### **Axis Labels**
- **Y-axis**: `P(feature|RSV)` (Probability of feature given RSV)
- **X-axis**: Features (e.g., `AGE - less5`, `Platelets - H`, `Eosinophils - L`, etc.)
#### **Legend**
- **Location**: Right side of the plot
- **Categories**: Years (2011–2020) with color codes:
- `2011to2012`: Pink
- `2012to2013`: Red
- `2013to2014`: Light pink
- `2014to2015`: Orange
- `2015to2016`: Green
- `2016to2017`: Dark green
- `2017to2018`: Light blue
- `2018to2019`: Blue
- `2019to2020`: Purple
#### **Key Trends**
1. **AGE - less5**:
- Highest P(feature|RSV) in `2011to2012` (~0.95).
- Gradual decline to ~0.7 by `2019to2020`.
2. **Platelets - H**:
- Peaks at ~0.2 in `2011to2012`, drops to ~0.1 by `2019to2020`.
3. **Eosinophils - L**:
- Rises from ~0.1 in `2011to2012` to ~0.2 in `2016to2017`, then declines.
4. **Monocytes/100 leukocytes - H**:
- Stable (~0.1–0.2) across all years.
5. **Anion gap - L**:
- Peaks at ~0.2 in `2017to2018`, then decreases.
6. **Potassium - H**:
- Peaks at ~0.15 in `2014to2015`, then declines.
7. **Oxygen saturation - N/L**:
- Stable (~0.05–0.1) across years.
8. **C reactive protein - N/H**:
- Peaks at ~0.15 in `2018to2019`, then declines.
9. **Magnesium - H**:
- Peaks at ~0.15 in `2018to2019`, then declines.
10. **Increased work of breathing**:
- Peaks at ~0.15 in `2018to2019`, then declines.
---
### **Subplot b: Log10(P(feature|RSV)/P(feature|non-RSV))**
#### **Axis Labels**
- **Y-axis**: `Log10(P(feature|RSV)/P(feature|non-RSV))`
- **X-axis**: Features (same as subplot a, with suffixes `-H`, `-N`, `-L`).
#### **Legend**
- **Location**: Below subplot b
- **Categories**:
- `-H`: High (e.g., `Platelets - H`)
- `-N`: Normal (e.g., `Oxygen saturation - N`)
- `-L`: Low (e.g., `Eosinophils - L`)
#### **Key Trends**
1. **AGE - less5**:
- Highest ratio (~3.0) in `2011to2012`, declines to ~0.8 by `2019to2020`.
2. **Platelets - H**:
- Peaks at ~2.5 in `2011to2012`, drops to ~1.0 by `2019to2020`.
3. **Eosinophils - L**:
- Peaks at ~1.5 in `2014to2015`, declines to ~0.5 by `2019to2020`.
4. **Monocytes/100 leukocytes - H**:
- Stable (~0.5–1.0) across years.
5. **Anion gap - L**:
- Peaks at ~2.0 in `2013to2014`, declines to ~0.5 by `2019to2020`.
6. **Potassium - H**:
- Peaks at ~1.5 in `2014to2015`, declines to ~0.5 by `2019to2020`.
7. **Oxygen saturation - N/L**:
- Stable (~0.5–1.0) across years.
8. **C reactive protein - N/H**:
- Peaks at ~2.5 in `2013to2014`, declines to ~1.0 by `2019to2020`.
9. **Magnesium - H**:
- Peaks at ~2.0 in `2013to2014`, declines to ~1.0 by `2019to2020`.
10. **Increased work of breathing**:
- Peaks at ~1.5 in `2018to2019`, declines to ~0.5 by `2019to2020`.
---
### **Cross-Referenced Observations**
- **Color Consistency**:
- Subplot a’s year colors match subplot b’s suffix colors (e.g., `2011to2012` pink corresponds to `-H` in subplot b).
- **Temporal Decline**: Most features show decreasing P(feature|RSV) and Log10 ratios over time, suggesting reduced RSV-associated feature prevalence.
- **Feature-Specific Patterns**:
- `AGE - less5` and `Platelets - H` exhibit the steepest declines.
- Features like `Oxygen saturation - N/L` remain stable.
---
### **Conclusion**
The plots highlight temporal trends in RSV-associated features, with most showing declining probabilities over the decade. Subplot b emphasizes the relative importance of features (via Log10 ratios), where `-H` (high) features dominate early years but diminish later.