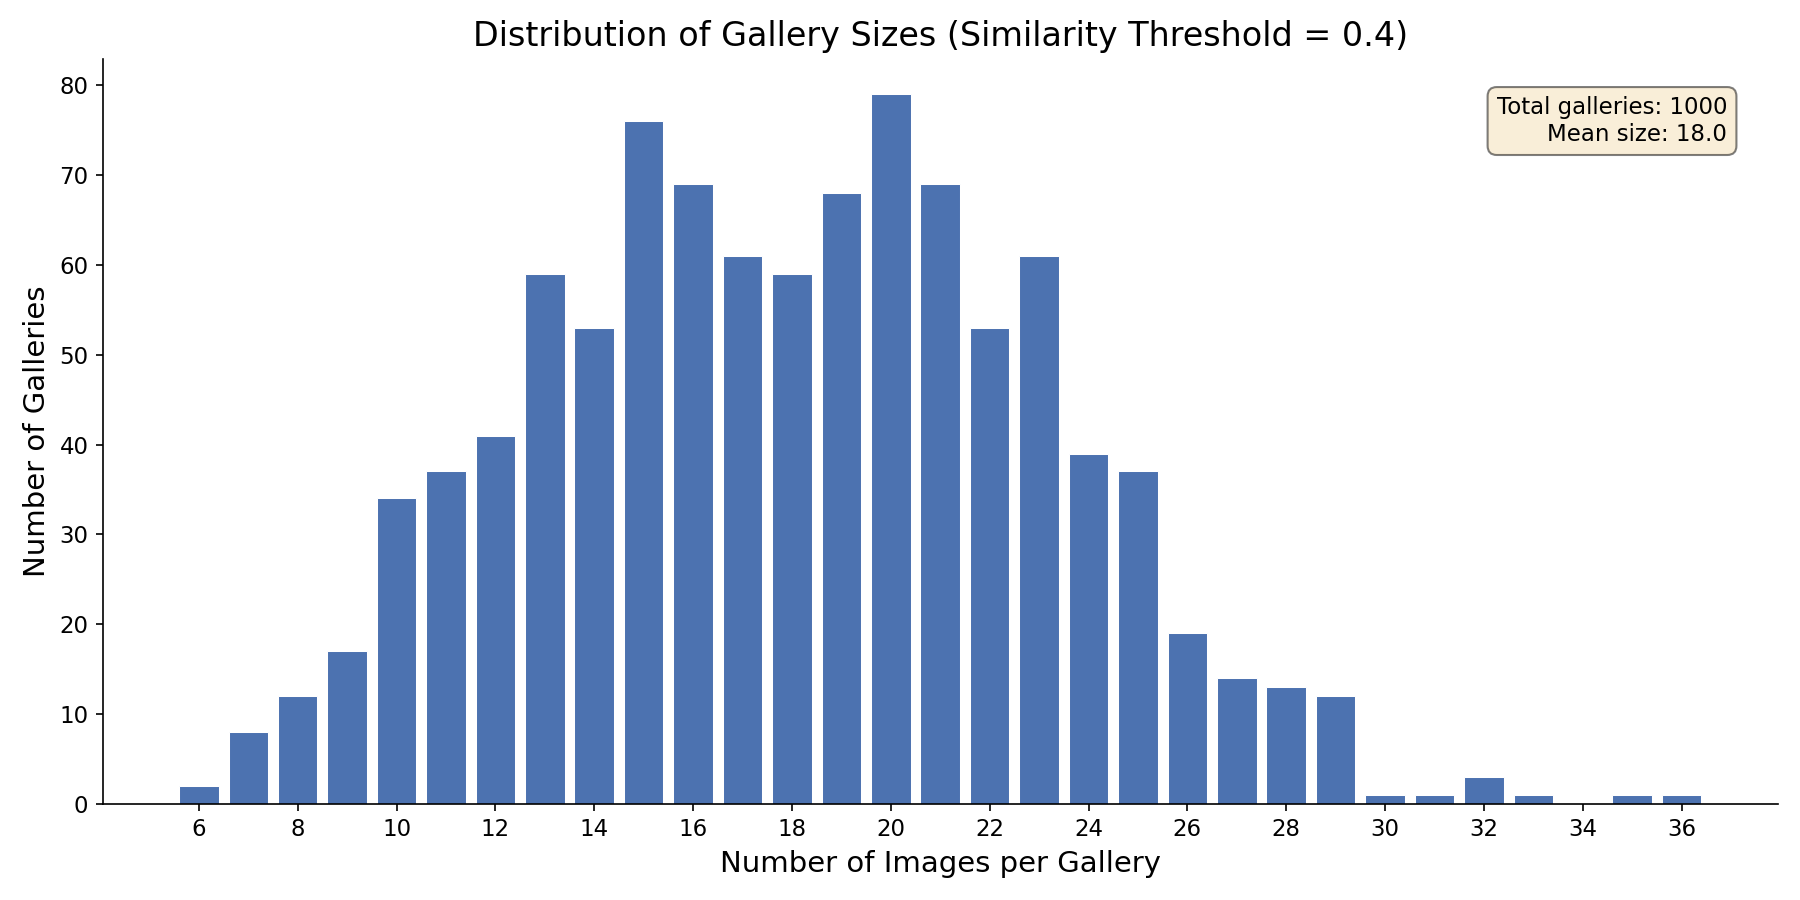
## Bar Chart: Distribution of Gallery Sizes (Similarity Threshold = 0.4)
### Overview
The chart visualizes the distribution of gallery sizes, where "gallery size" is defined as the number of images per gallery. The x-axis represents the number of images per gallery (ranging from 6 to 36), and the y-axis represents the number of galleries (ranging from 0 to 80). The total number of galleries analyzed is 1,000, with a mean gallery size of 18.0 images. The data is represented by a single blue bar series.
### Components/Axes
- **X-Axis**: "Number of Images per Gallery" (discrete intervals from 6 to 36, incrementing by 2).
- **Y-Axis**: "Number of Galleries" (continuous scale from 0 to 80).
- **Legend**: Located in the top-right corner, labeled with "Total galleries: 1000" and "Mean size: 18.0". The bar color is blue.
- **Title**: "Distribution of Gallery Sizes (Similarity Threshold = 0.4)" (note: the threshold value is provided but not visually represented in the chart).
### Detailed Analysis
- **Bar Heights**:
- The tallest bar corresponds to **20 images per gallery**, with approximately **80 galleries**.
- The second-tallest bar is at **19 images per gallery**, with ~75 galleries.
- Bars decrease symmetrically on either side of the peak, with gradual declines toward the extremes (e.g., ~10 galleries at 6 images, ~5 galleries at 36 images).
- The mean value of 18.0 is marked in the legend but not visually indicated on the chart.
- **Distribution Shape**:
- The distribution is **unimodal**, peaking at 20 images per gallery.
- The mean (18.0) is slightly left of the peak, suggesting a **left-skewed distribution** (longer tail on the lower end).
### Key Observations
1. **Peak at 20 Images**: The majority of galleries (80) cluster around 20 images, indicating this is the most common size.
2. **Mean vs. Peak**: The mean (18.0) is lower than the peak (20), confirming left skewness.
3. **Tapered Extremes**: Galleries with very few (<10) or very many (>30) images are rare, with counts dropping to ~1–2 galleries at the extremes.
4. **Total Validation**: The sum of all bar heights approximates 1,000 galleries, aligning with the subtitle.
### Interpretation
The data suggests that most galleries in this dataset contain a moderate number of images (centered around 20), but the presence of smaller galleries (with fewer images) pulls the mean below the mode. The similarity threshold of 0.4 may relate to how galleries are grouped or filtered in the dataset, though this is not visually represented. The left skew implies that while larger galleries exist, they are outnumbered by smaller ones, creating a balance skewed toward lower sizes. This distribution could reflect practical constraints (e.g., curation efforts, resource limits) or algorithmic biases in gallery formation.