## Heatmap: Soundscape Frequency Analysis by Ear and Environment
### Overview
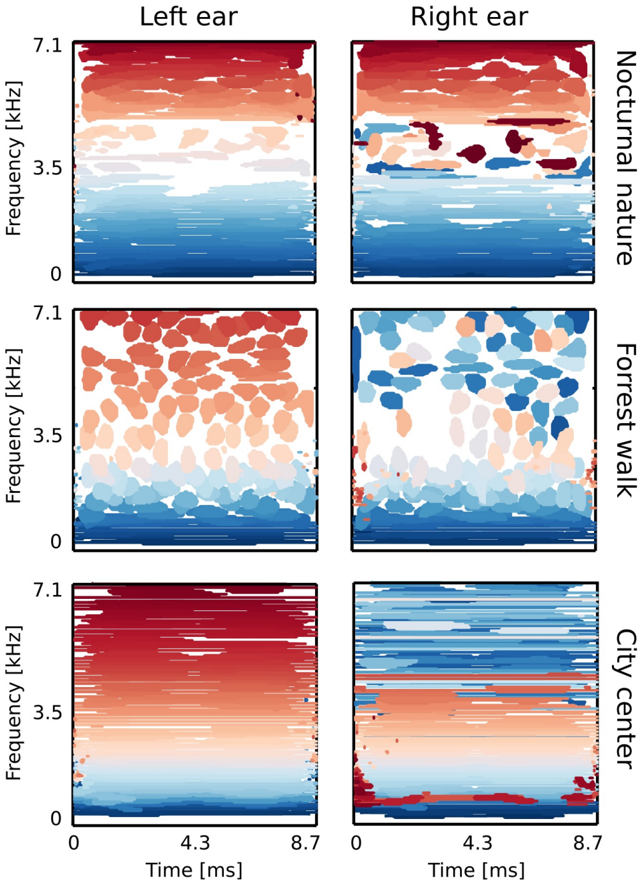
This image presents a 3x2 grid of heatmaps visualizing soundscape frequency analysis. Each heatmap represents a different environment (Nocturnal nature, Forest walk, City center) and is split into two panels: one for the "Left ear" and one for the "Right ear". The heatmaps display frequency (in kHz) on the y-axis and time (in ms) on the x-axis, with color representing the intensity of sound at that frequency and time.
### Components/Axes
* **X-axis:** Time [ms], ranging from 0 to 8.7 ms.
* **Y-axis:** Frequency [kHz], ranging from 0 to 7.1 kHz.
* **Color Scale:** A diverging color scale is used, with red representing higher sound intensity, blue representing lower sound intensity, and shades of orange and cyan representing intermediate intensities.
* **Labels:**
* "Left ear" (top-left of the left column)
* "Right ear" (top-left of the right column)
* "Nocturnal nature" (top-right of the left column)
* "Forest walk" (center-right of the left column)
* "City center" (bottom-right of the left column)
* **Grid Structure:** 3 rows (environments) x 2 columns (ears).
### Detailed Analysis or Content Details
**1. Nocturnal Nature:**
* **Left Ear:** A relatively sparse distribution of sound. Higher frequencies (above 3.5 kHz) show some scattered red areas, indicating occasional bursts of higher-intensity sound. The lower frequencies (0-2 kHz) are predominantly blue, indicating low intensity. There's a slight upward trend in intensity towards 8.7ms.
* **Right Ear:** Similar to the left ear, but with a more pronounced concentration of red areas in the 2-4 kHz range around 4.3ms. Lower frequencies are also predominantly blue.
**2. Forest Walk:**
* **Left Ear:** More consistent sound intensity across frequencies compared to Nocturnal Nature. A significant band of orange/red color is visible between 2-5 kHz, particularly around 4.3ms. Lower frequencies remain predominantly blue.
* **Right Ear:** Similar pattern to the left ear, but with a more defined band of orange/red between 2-5 kHz. The intensity appears slightly higher overall compared to the left ear.
**3. City Center:**
* **Left Ear:** High sound intensity across almost all frequencies and time points. Predominantly red and orange, indicating a consistently loud environment. There's a slight increase in intensity towards 8.7ms.
* **Right Ear:** Similar to the left ear, with high sound intensity across all frequencies. The distribution appears slightly more uniform, with less distinct banding than in the Forest Walk environment.
### Key Observations
* **Environmental Differences:** The City Center exhibits the highest overall sound intensity, followed by the Forest Walk, and then Nocturnal Nature.
* **Frequency Distribution:** The Forest Walk shows a concentration of sound in the 2-5 kHz range, potentially indicating bird song or rustling leaves.
* **Ear Differences:** There are subtle differences in sound intensity between the left and right ears, suggesting directional sound sources. The right ear often shows slightly higher intensity, but this varies by environment.
* **Temporal Trends:** In some environments (Nocturnal Nature, City Center), there's a slight increase in sound intensity towards the end of the time window (8.7ms).
### Interpretation
This data suggests a clear relationship between the environment and the soundscape characteristics. The Nocturnal Nature environment is the quietest, with sound primarily concentrated in lower frequencies. The Forest Walk environment is characterized by a more balanced frequency distribution, with a notable presence of mid-range frequencies. The City Center environment is the loudest, with sound present across the entire frequency spectrum.
The subtle differences between the left and right ears indicate that the soundscape is not uniform and that sound sources are likely directional. The slight increase in sound intensity towards the end of the time window in some environments could indicate a change in the soundscape over time, such as an approaching sound source or a gradual increase in ambient noise.
The heatmaps provide a visual representation of the complexity of soundscapes and how they vary depending on the environment. This type of analysis could be used to assess noise pollution, study animal communication, or design more effective noise cancellation systems. The diverging color scheme effectively highlights the relative intensity of sound at different frequencies and time points, making it easy to identify patterns and trends.