## Cumulative Distribution Function (CDF) Chart: CDF of Δ||h|| Norms (Token vs Step)
### Overview
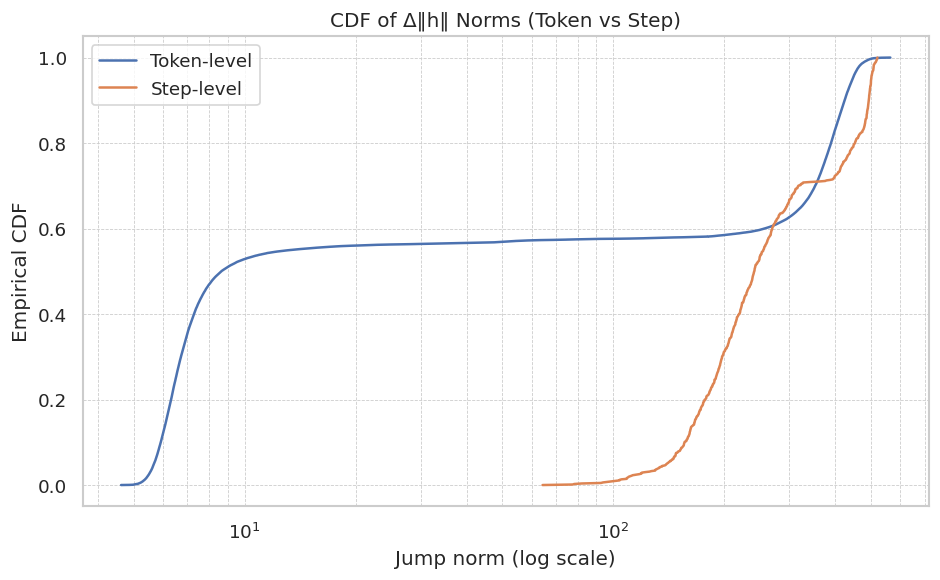
The image is a cumulative distribution function (CDF) chart comparing the distribution of Δ||h|| norms at the token level and step level. The x-axis represents the jump norm (log scale), and the y-axis represents the empirical CDF. Two lines, one blue (Token-level) and one brown (Step-level), show the cumulative distribution for each level.
### Components/Axes
* **Title:** CDF of Δ||h|| Norms (Token vs Step)
* **X-axis:** Jump norm (log scale). The x-axis is on a logarithmic scale. The axis markers are 10^1 and 10^2.
* **Y-axis:** Empirical CDF. The y-axis ranges from 0.0 to 1.0, with markers at 0.0, 0.2, 0.4, 0.6, 0.8, and 1.0.
* **Legend:** Located in the top-left corner.
* **Blue line:** Token-level
* **Brown line:** Step-level
### Detailed Analysis
* **Token-level (Blue):** The blue line represents the cumulative distribution of Δ||h|| norms at the token level.
* The line starts at approximately (5, 0.0).
* It rises sharply until approximately x=10, reaching a CDF value of approximately 0.55.
* The line then plateaus around 0.58 until approximately x=30.
* After x=30, the line slowly increases until approximately x=100.
* The line then rises sharply again, reaching a CDF value of 1.0 at approximately x=200.
* **Step-level (Brown):** The brown line represents the cumulative distribution of Δ||h|| norms at the step level.
* The line starts at approximately (80, 0.0).
* It remains near 0.0 until approximately x=100.
* The line then rises sharply, reaching a CDF value of approximately 0.7 at x=200.
* The line continues to rise, reaching a CDF value of 1.0 at approximately x=300.
### Key Observations
* The Token-level distribution has a significant portion of its values concentrated at lower jump norms compared to the Step-level distribution.
* The Step-level distribution starts increasing much later than the Token-level distribution, indicating that higher jump norms are more prevalent at the step level.
* Both distributions eventually reach a CDF of 1.0, meaning that all values are accounted for in the cumulative distribution.
### Interpretation
The CDF chart compares the distribution of Δ||h|| norms at the token and step levels. The Token-level distribution shows that a large proportion of tokens have relatively small jump norms, as indicated by the rapid increase in the CDF at lower x-values. The Step-level distribution, on the other hand, shows that the jump norms tend to be larger, as indicated by the delayed increase in the CDF. This suggests that the changes in the hidden state are more gradual at the token level, while larger changes occur at the step level. The plateau in the Token-level distribution suggests that there is a limit to how much the hidden state changes at the token level, while the Step-level distribution shows that there is no such limit.