\n
## Chart: CDF of Δ||h|| Norms (Token vs Step)
### Overview
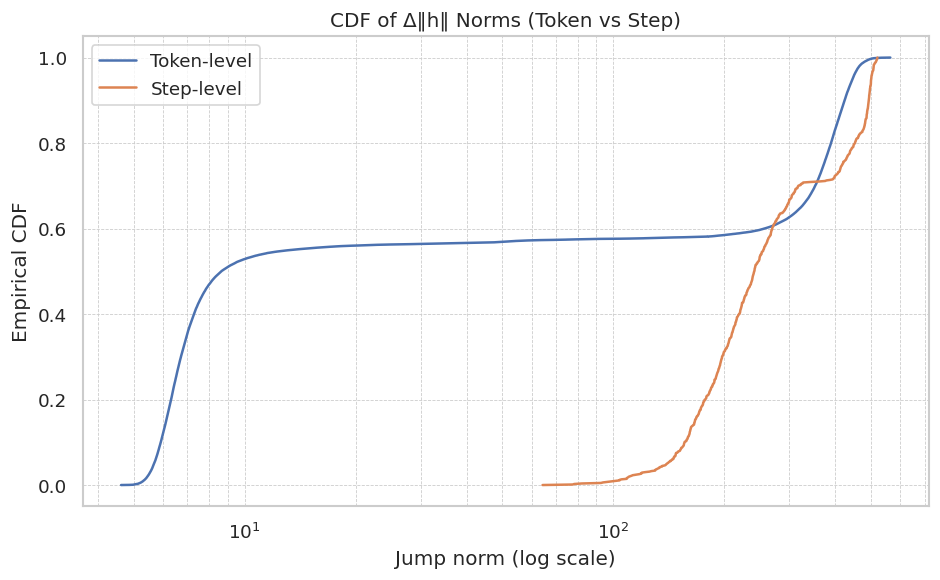
The image presents a cumulative distribution function (CDF) plot comparing the norms of the difference in hidden states (Δ||h||) at the token-level and step-level. The x-axis represents the jump norm on a logarithmic scale, and the y-axis represents the empirical CDF. Two curves are plotted, one for token-level and one for step-level, showing the distribution of these norms.
### Components/Axes
* **Title:** CDF of Δ||h|| Norms (Token vs Step) - positioned at the top-center.
* **X-axis Label:** Jump norm (log scale) - positioned at the bottom-center. The scale is logarithmic, with approximate markers at 10<sup>0</sup>, 10<sup>1</sup>, and 10<sup>2</sup>.
* **Y-axis Label:** Empirical CDF - positioned at the left-center. The scale ranges from 0.0 to 1.0, with markers at 0.0, 0.2, 0.4, 0.6, 0.8, and 1.0.
* **Legend:** Located at the top-left corner.
* **Token-level:** Represented by a blue line.
* **Step-level:** Represented by an orange line.
### Detailed Analysis
The chart displays two CDF curves.
**Token-level (Blue Line):**
The curve starts at approximately 0.0 at a jump norm of 10<sup>0</sup>. It rapidly increases to approximately 0.55-0.60 around a jump norm of 10<sup>1</sup>, and remains relatively flat until a jump norm of approximately 50-75, where it begins to increase more steeply. It reaches approximately 0.95 at a jump norm of 10<sup>2</sup> and approaches 1.0.
**Step-level (Orange Line):**
The curve starts at approximately 0.0 at a jump norm of 10<sup>0</sup>. It remains close to 0.0 until a jump norm of approximately 20-30, where it begins to increase. It reaches approximately 0.5 at a jump norm of 10<sup>2</sup>, and continues to increase, reaching approximately 0.95 at a jump norm of 10<sup>2</sup>.
### Key Observations
* The token-level CDF is generally higher than the step-level CDF for jump norms less than approximately 50-75.
* The step-level CDF exhibits a delayed increase compared to the token-level CDF. The step-level CDF remains near 0.0 for a larger range of jump norms.
* Both CDFs approach 1.0 as the jump norm increases, indicating that the probability of observing a jump norm less than a given value approaches 1.0 for large jump norms.
* The token-level CDF plateaus for a significant range of jump norms (approximately 10<sup>1</sup> to 50-75).
### Interpretation
This chart compares the distribution of changes in hidden state norms at the token and step levels. The higher CDF values for the token-level curve at lower jump norms suggest that token-level changes in hidden states tend to be smaller than step-level changes. The plateau in the token-level CDF indicates that a significant proportion of tokens have similar changes in hidden state norms. The delayed increase in the step-level CDF suggests that step-level changes are less frequent but can be larger in magnitude.
The difference in CDFs could indicate that the model processes information at the token level with relatively small adjustments to the hidden state, while step-level processing involves more substantial changes. This could be related to the model's architecture or the nature of the task it is performing. The logarithmic scale on the x-axis highlights the range of jump norms and emphasizes the differences in distribution between the two levels. The chart provides insights into the dynamics of hidden state changes during model processing.