## Line Chart: CDF of Δ∥h∥ Norms (Token vs Step)
### Overview
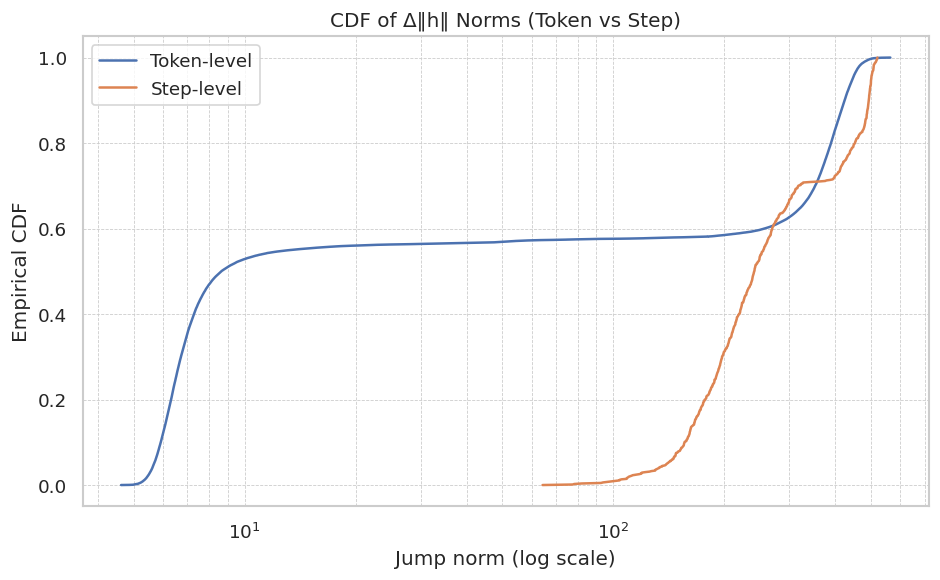
The chart compares the cumulative distribution function (CDF) of jump norms for token-level and step-level data. The x-axis represents jump norm values on a logarithmic scale (10¹ to 10³), while the y-axis shows the empirical CDF (0 to 1.0). Two curves are plotted: a blue line for token-level norms and an orange line for step-level norms.
### Components/Axes
- **Title**: "CDF of Δ∥h∥ Norms (Token vs Step)"
- **Legend**:
- Top-left corner, labeled "Token-level" (blue) and "Step-level" (orange).
- **X-axis**:
- Label: "Jump norm (log scale)"
- Range: 10¹ to 10³ (logarithmic scale, with gridlines at 10¹, 10², 10³).
- **Y-axis**:
- Label: "Empirical CDF"
- Range: 0.0 to 1.0 (linear scale, with gridlines at 0.0, 0.2, 0.4, 0.6, 0.8, 1.0).
### Detailed Analysis
- **Token-level (Blue Line)**:
- Starts at ~0.0 at 10¹, rises sharply to ~0.6 by 10², then plateaus until ~10².5.
- Jumps sharply to 1.0 at ~10³.
- Key data points:
- 10¹: ~0.0
- 10²: ~0.6
- 10³: 1.0
- **Step-level (Orange Line)**:
- Remains at 0.0 until ~10², then rises gradually to ~0.6 by 10².5.
- Accelerates sharply to 1.0 at ~10³.
- Key data points:
- 10²: ~0.0
- 10².5: ~0.6
- 10³: 1.0
### Key Observations
1. **Token-level norms** exhibit a steeper initial increase, reaching 0.6 at 10², while **step-level norms** remain near 0 until 10².
2. Both curves converge at 1.0 at 10³, indicating all data points are accounted for.
3. The step-level curve is more gradual in its rise, suggesting a wider distribution of norms compared to token-level.
### Interpretation
- **Token-level norms** are concentrated at lower jump norms, with a sharp threshold effect around 10³. This suggests token-level norms are smaller and more uniformly distributed below this threshold.
- **Step-level norms** are spread across higher jump norms, with a gradual increase until 10².5, indicating variability in step-level norm magnitudes.
- The plateau in the token-level curve (~10² to 10².5) may reflect a saturation point or a distinct clustering of norms in this range.
- The step-level curve’s delayed rise implies step-level norms are less sensitive to small jump norm values, requiring larger thresholds to contribute significantly to the CDF.
The data highlights fundamental differences in norm distribution between token- and step-level representations, with token-level norms being more tightly clustered at lower magnitudes.