## Line Chart: Accuracy vs. Attack Ratio for Different Federated Learning Methods
### Overview
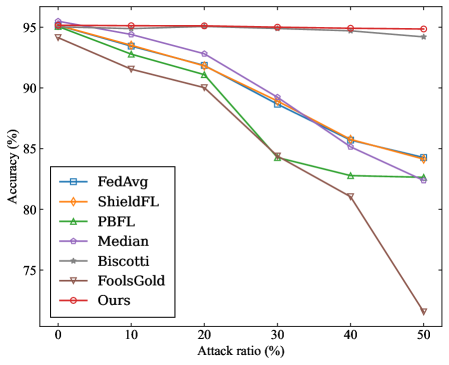
The image is a line chart comparing the accuracy of different federated learning methods under varying attack ratios. The x-axis represents the attack ratio (percentage), and the y-axis represents the accuracy (percentage). Several lines represent different federated learning methods, each with a distinct color and marker.
### Components/Axes
* **X-axis:** Attack ratio (%), with markers at 0, 10, 20, 30, 40, and 50.
* **Y-axis:** Accuracy (%), with markers at 75, 80, 85, 90, and 95.
* **Legend (located on the left side of the chart):**
* Blue with square marker: FedAvg
* Orange with diamond marker: ShieldFL
* Green with triangle marker: PBFL
* Purple with rotated square marker: Median
* Gray with star marker: Biscotti
* Brown with inverted triangle marker: FoolsGold
* Red with circle marker: Ours
### Detailed Analysis
**FedAvg (Blue, Square Marker):**
* At 0% attack ratio, accuracy is approximately 95%.
* At 10% attack ratio, accuracy is approximately 94%.
* At 20% attack ratio, accuracy is approximately 93%.
* At 30% attack ratio, accuracy is approximately 89%.
* At 40% attack ratio, accuracy is approximately 86%.
* At 50% attack ratio, accuracy is approximately 84%.
* Trend: Decreasing accuracy as the attack ratio increases.
**ShieldFL (Orange, Diamond Marker):**
* At 0% attack ratio, accuracy is approximately 95%.
* At 10% attack ratio, accuracy is approximately 94%.
* At 20% attack ratio, accuracy is approximately 92%.
* At 30% attack ratio, accuracy is approximately 89%.
* At 40% attack ratio, accuracy is approximately 86%.
* At 50% attack ratio, accuracy is approximately 84%.
* Trend: Decreasing accuracy as the attack ratio increases.
**PBFL (Green, Triangle Marker):**
* At 0% attack ratio, accuracy is approximately 95%.
* At 10% attack ratio, accuracy is approximately 93%.
* At 20% attack ratio, accuracy is approximately 92%.
* At 30% attack ratio, accuracy is approximately 84%.
* At 40% attack ratio, accuracy is approximately 83%.
* At 50% attack ratio, accuracy is approximately 82%.
* Trend: Decreasing accuracy as the attack ratio increases.
**Median (Purple, Rotated Square Marker):**
* At 0% attack ratio, accuracy is approximately 95%.
* At 10% attack ratio, accuracy is approximately 95%.
* At 20% attack ratio, accuracy is approximately 95%.
* At 30% attack ratio, accuracy is approximately 90%.
* At 40% attack ratio, accuracy is approximately 86%.
* At 50% attack ratio, accuracy is approximately 84%.
* Trend: Decreasing accuracy as the attack ratio increases.
**Biscotti (Gray, Star Marker):**
* At 0% attack ratio, accuracy is approximately 95%.
* At 10% attack ratio, accuracy is approximately 95%.
* At 20% attack ratio, accuracy is approximately 95%.
* At 30% attack ratio, accuracy is approximately 95%.
* At 40% attack ratio, accuracy is approximately 94%.
* At 50% attack ratio, accuracy is approximately 94%.
* Trend: Relatively stable accuracy as the attack ratio increases.
**FoolsGold (Brown, Inverted Triangle Marker):**
* At 0% attack ratio, accuracy is approximately 94%.
* At 10% attack ratio, accuracy is approximately 92%.
* At 20% attack ratio, accuracy is approximately 91%.
* At 30% attack ratio, accuracy is approximately 90%.
* At 40% attack ratio, accuracy is approximately 81%.
* At 50% attack ratio, accuracy is approximately 72%.
* Trend: Decreasing accuracy as the attack ratio increases.
**Ours (Red, Circle Marker):**
* At 0% attack ratio, accuracy is approximately 95%.
* At 10% attack ratio, accuracy is approximately 95%.
* At 20% attack ratio, accuracy is approximately 95%.
* At 30% attack ratio, accuracy is approximately 95%.
* At 40% attack ratio, accuracy is approximately 95%.
* At 50% attack ratio, accuracy is approximately 95%.
* Trend: Stable accuracy as the attack ratio increases.
### Key Observations
* The "Ours" method (red line) maintains a consistently high accuracy (around 95%) regardless of the attack ratio.
* The "Biscotti" method (gray line) also shows relatively stable accuracy, with a slight decrease at higher attack ratios.
* The "FoolsGold" method (brown line) experiences the most significant drop in accuracy as the attack ratio increases.
* The other methods (FedAvg, ShieldFL, PBFL, Median) show a moderate decrease in accuracy as the attack ratio increases.
### Interpretation
The chart demonstrates the robustness of different federated learning methods against attacks. The "Ours" method appears to be the most resilient, maintaining high accuracy even with a high attack ratio. "Biscotti" also shows good resilience. In contrast, "FoolsGold" is highly susceptible to attacks, with its accuracy plummeting as the attack ratio increases. The other methods exhibit varying degrees of vulnerability. This suggests that the "Ours" method and "Biscotti" are better suited for environments where adversarial attacks are a concern. The data highlights the importance of choosing a robust federated learning method to ensure reliable performance in the presence of malicious actors.