## Line Chart: Accuracy vs. Attack Ratio for Federated Learning Algorithms
### Overview
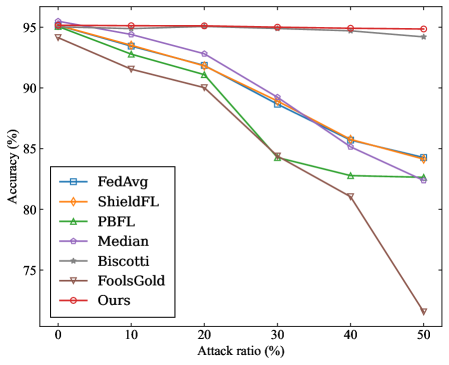
This image presents a line chart comparing the accuracy of several Federated Learning (FL) algorithms under varying attack ratios. The x-axis represents the attack ratio (percentage), and the y-axis represents the accuracy (percentage). The chart displays how each algorithm's performance degrades as the attack ratio increases.
### Components/Axes
* **X-axis:** "Attack ratio (%)" - Scale ranges from 0% to 50%, with markers at 0, 10, 20, 30, 40, and 50.
* **Y-axis:** "Accuracy (%)" - Scale ranges from 70% to 96%, with markers at 70, 75, 80, 85, 90, 95.
* **Legend:** Located in the bottom-left corner, listing the following algorithms with corresponding line colors:
* FedAvg (Blue)
* ShieldFL (Orange)
* PBFL (Green)
* Median (Purple)
* Biscotti (Grey)
* FoolsGold (Yellow)
* Ours (Red)
### Detailed Analysis
Here's a breakdown of each algorithm's performance based on the chart:
* **FedAvg (Blue):** Starts at approximately 94.5% accuracy at 0% attack ratio. The line slopes downward, reaching approximately 88% accuracy at 50% attack ratio.
* **ShieldFL (Orange):** Begins at approximately 94% accuracy at 0% attack ratio. The line declines steadily, reaching approximately 84% accuracy at 50% attack ratio.
* **PBFL (Green):** Starts at approximately 93% accuracy at 0% attack ratio. The line shows a significant drop, reaching approximately 84% accuracy at 50% attack ratio.
* **Median (Purple):** Starts at approximately 94% accuracy at 0% attack ratio. The line declines moderately, reaching approximately 87% accuracy at 50% attack ratio.
* **Biscotti (Grey):** Starts at approximately 93.5% accuracy at 0% attack ratio. The line declines sharply, reaching approximately 80% accuracy at 50% attack ratio.
* **FoolsGold (Yellow):** Starts at approximately 93% accuracy at 0% attack ratio. The line declines very sharply, reaching approximately 72% accuracy at 50% attack ratio.
* **Ours (Red):** Starts at approximately 95% accuracy at 0% attack ratio. The line remains relatively flat, maintaining approximately 94.5% accuracy even at 50% attack ratio.
### Key Observations
* The "Ours" algorithm consistently outperforms all other algorithms across all attack ratios.
* FoolsGold exhibits the most significant performance degradation with increasing attack ratio.
* FedAvg, ShieldFL, PBFL, and Median show similar performance degradation patterns, but with varying degrees of severity.
* Biscotti shows a more pronounced decline than FedAvg, ShieldFL, and Median.
* The performance of all algorithms decreases as the attack ratio increases, as expected.
### Interpretation
The data suggests that the proposed algorithm ("Ours") is significantly more robust to attacks in a Federated Learning setting compared to the other algorithms tested. The flat line representing "Ours" indicates that its accuracy remains stable even with a 50% attack ratio, implying a strong defense mechanism.
The sharp decline in accuracy for FoolsGold suggests it is highly vulnerable to attacks. The other algorithms demonstrate varying levels of vulnerability, with ShieldFL and Median showing relatively better resilience than Biscotti and PBFL.
The relationship between the algorithms is clear: they represent different approaches to Federated Learning, and their performance under attack highlights the effectiveness of their respective defense strategies. The outlier is clearly "Ours", which stands out due to its consistent high accuracy. This could be due to a novel defense mechanism or a more robust training procedure.
The chart demonstrates the importance of considering security and robustness when deploying Federated Learning systems, as even a moderate attack ratio can significantly impact performance. The results suggest that the "Ours" algorithm is a promising solution for mitigating the risks associated with adversarial attacks in Federated Learning.