## Line Chart: Accuracy vs. Attack Ratio for Federated Learning Methods
### Overview
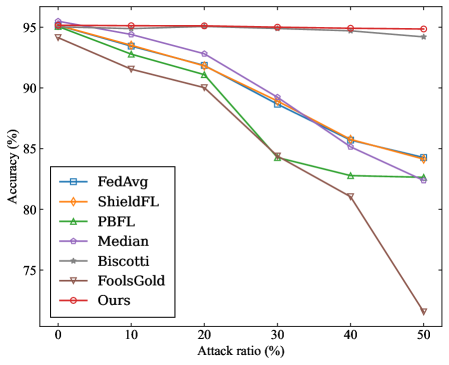
The image is a line chart comparing the performance (accuracy) of seven different federated learning methods or defenses as the ratio of adversarial attacks increases. The chart demonstrates how each method's accuracy degrades under increasing levels of attack.
### Components/Axes
* **Chart Type:** Line chart with markers.
* **X-Axis:** Labeled **"Attack ratio (%)"**. It has major tick marks at 0, 10, 20, 30, 40, and 50.
* **Y-Axis:** Labeled **"Accuracy (%)"**. It has major tick marks at 75, 80, 85, 90, and 95.
* **Legend:** Located in the **bottom-left corner** of the chart area. It lists seven methods with corresponding line colors and marker styles:
1. **FedAvg** - Blue line with square markers (□).
2. **ShieldFL** - Orange line with diamond markers (◇).
3. **PBFL** - Green line with upward-pointing triangle markers (△).
4. **Median** - Purple line with circle markers (○).
5. **Biscotti** - Gray line with star/asterisk markers (✳).
6. **FoolsGold** - Brown line with downward-pointing triangle markers (▽).
7. **Ours** - Red line with circle markers (○).
### Detailed Analysis
The following data points are approximate, extracted by visually aligning markers with the axis ticks.
| Attack Ratio (%) | FedAvg (Blue, □) | ShieldFL (Orange, ◇) | PBFL (Green, △) | Median (Purple, ○) | Biscotti (Gray, ✳) | FoolsGold (Brown, ▽) | Ours (Red, ○) |
| :--- | :--- | :--- | :--- | :--- | :--- | :--- | :--- |
| **0** | ~95.0 | ~95.0 | ~95.0 | ~95.0 | ~95.0 | ~94.0 | ~95.0 |
| **10** | ~93.0 | ~93.5 | ~92.5 | ~93.5 | ~95.0 | ~91.5 | ~95.0 |
| **20** | ~91.0 | ~91.5 | ~90.5 | ~92.5 | ~95.0 | ~90.0 | ~95.0 |
| **30** | ~88.5 | ~89.0 | ~84.5 | ~89.0 | ~95.0 | ~84.5 | ~95.0 |
| **40** | ~85.5 | ~86.0 | ~83.0 | ~86.0 | ~95.0 | ~81.0 | ~95.0 |
| **50** | ~82.5 | ~84.5 | ~82.5 | ~82.5 | ~94.0 | ~72.0 | ~94.5 |
**Trend Verification:**
* **FedAvg, ShieldFL, Median:** These three lines follow a very similar, steady downward slope. They start clustered near 95% and decline in near-parallel to between 82.5% and 84.5% at 50% attack ratio.
* **PBFL:** Starts with the group but shows a steeper decline between 20% and 30% attack ratio, then flattens somewhat, ending near 82.5%.
* **Biscotti:** Shows a very shallow, almost flat decline, maintaining accuracy above 94% across the entire range.
* **FoolsGold:** Exhibits the most severe and accelerating decline. It starts slightly lower than the main group and drops sharply after 30% attack ratio, plummeting to the lowest point on the chart (~72%).
* **Ours:** The red line is essentially flat, showing negligible decrease in accuracy from 0% to 50% attack ratio, staying at approximately 95%.
### Key Observations
1. **Performance Hierarchy:** At high attack ratios (40-50%), the methods clearly stratify. "Ours" and "Biscotti" are top-tier, "FoolsGold" is the worst-performing, and the others (FedAvg, ShieldFL, PBFL, Median) form a middle cluster.
2. **Robustness:** The method labeled "Ours" demonstrates exceptional robustness, with its accuracy line being nearly horizontal. "Biscotti" is also highly robust but shows a very slight decline.
3. **Vulnerability:** "FoolsGold" is highly vulnerable to increasing attack ratios, with its performance collapsing dramatically beyond a 30% attack ratio.
4. **Clustering:** The lines for FedAvg, ShieldFL, and Median are tightly clustered throughout, suggesting similar performance characteristics under these test conditions.
### Interpretation
This chart is likely from a research paper proposing a new federated learning defense method (labeled "Ours"). The data suggests that the proposed method significantly outperforms several baseline methods (FedAvg, ShieldFL, PBFL, Median, FoolsGold) in maintaining model accuracy as the environment becomes more hostile (higher percentage of malicious participants/attacks).
The key takeaway is the superior resilience of the "Ours" method. While other methods degrade—some severely like FoolsGold—the proposed method's performance remains virtually unaffected up to a 50% attack ratio. This implies it has a more effective mechanism for identifying and mitigating the impact of adversarial updates. The strong performance of "Biscotti" is also notable, indicating it is another robust baseline. The chart serves as strong visual evidence for the efficacy and stability of the authors' contribution compared to the state-of-the-art.