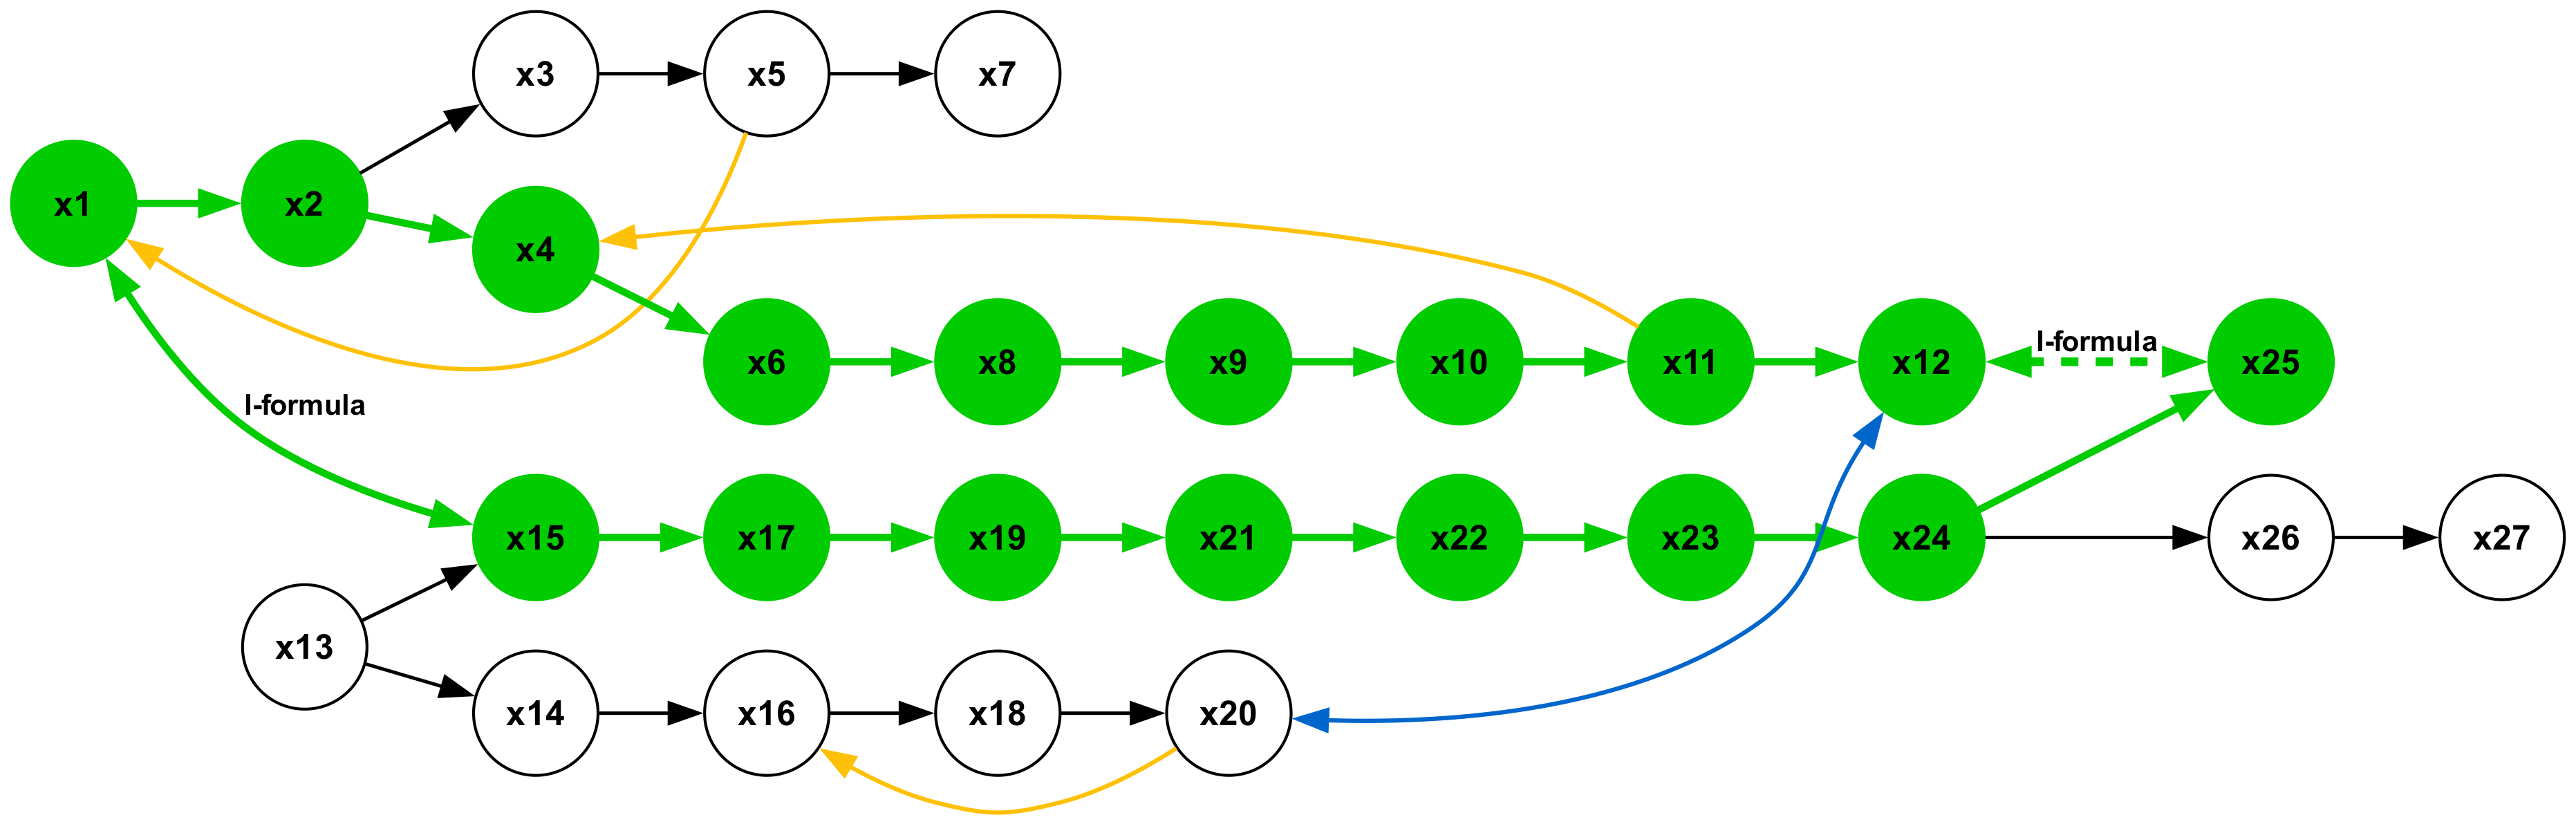
## Diagram: Dependency Graph
### Overview
The image is a directed graph representing dependencies between elements labeled x1 through x27. The nodes are represented by circles, and the dependencies are represented by arrows. Some nodes are colored green, while others are white. The arrows are colored black, green, blue, or yellow, indicating different types of relationships. The diagram shows a complex network of dependencies with several distinct paths and feedback loops.
### Components/Axes
* **Nodes:** Represented by circles labeled x1, x2, x3, x4, x5, x6, x7, x8, x9, x10, x11, x12, x13, x14, x15, x16, x17, x18, x19, x20, x21, x22, x23, x24, x25, x26, x27.
* Nodes x1, x2, x4, x6, x8, x9, x10, x11, x12, x15, x17, x19, x21, x22, x23, x24, x25 are filled with green.
* Nodes x3, x5, x7, x13, x14, x16, x18, x20, x26, x27 are white.
* **Edges:** Represented by arrows, indicating the direction of dependency.
* Black arrows: Represent standard dependencies.
* Green arrows: Labeled "I-formula", represent a specific type of dependency.
* Blue arrow: Represents a specific type of dependency.
* Yellow arrows: Represent a specific type of dependency.
* **Labels:** "I-formula" is used to label specific green arrows.
### Detailed Analysis
* **Top Row:**
* x1 (green) -> x2 (green) -> x4 (green)
* x3 (white) -> x5 (white) -> x7 (white)
* **Middle Row:**
* x6 (green) -> x8 (green) -> x9 (green) -> x10 (green) -> x11 (green) -> x12 (green) --(dashed green arrow labeled "I-formula")--> x25 (green)
* **Bottom Row:**
* x15 (green) -> x17 (green) -> x19 (green) -> x21 (green) -> x22 (green) -> x23 (green) -> x24 (green) -> x26 (white) -> x27 (white)
* x13 (white) -> x14 (white) -> x16 (white) -> x18 (white) -> x20 (white)
* **Connections:**
* x2 (green) -> x3 (white)
* x4 (green) --(yellow arrow)--> x5 (white)
* x15 (green) -> x13 (white)
* x15 (green) --(green arrow labeled "I-formula")--> x1 (green)
* x18 (white) --(yellow arrow)--> x4 (green)
* x20 (white) --(blue arrow)--> x12 (green)
* x24 (green) -> x25 (green)
### Key Observations
* The graph has three main horizontal rows of nodes.
* Green nodes seem to represent a "processed" or "active" state, while white nodes might represent an "unprocessed" or "inactive" state.
* The "I-formula" label on the green arrows suggests a specific transformation or calculation is applied.
* There are feedback loops in the graph, notably from x15 back to x1 and from x18 to x4.
* Node x25 is connected to x12 via a dashed green arrow labeled "I-formula", suggesting a conditional or optional dependency.
### Interpretation
The diagram likely represents a workflow or process flow where data or information moves through a series of steps. The green nodes could represent steps that are currently active or have been completed, while the white nodes could represent steps that are pending or have not been initiated. The arrows indicate the order in which the steps are executed, and the different colors of the arrows could represent different types of dependencies or relationships between the steps. The "I-formula" label suggests that a specific calculation or transformation is applied at certain steps in the process. The feedback loops indicate that the process can iterate or repeat certain steps based on the outcome of previous steps. The dashed arrow from x12 to x25 suggests that this dependency is conditional, and the process may or may not proceed along this path depending on certain conditions.