\n
## Diagram: Process Flow with Variables
### Overview
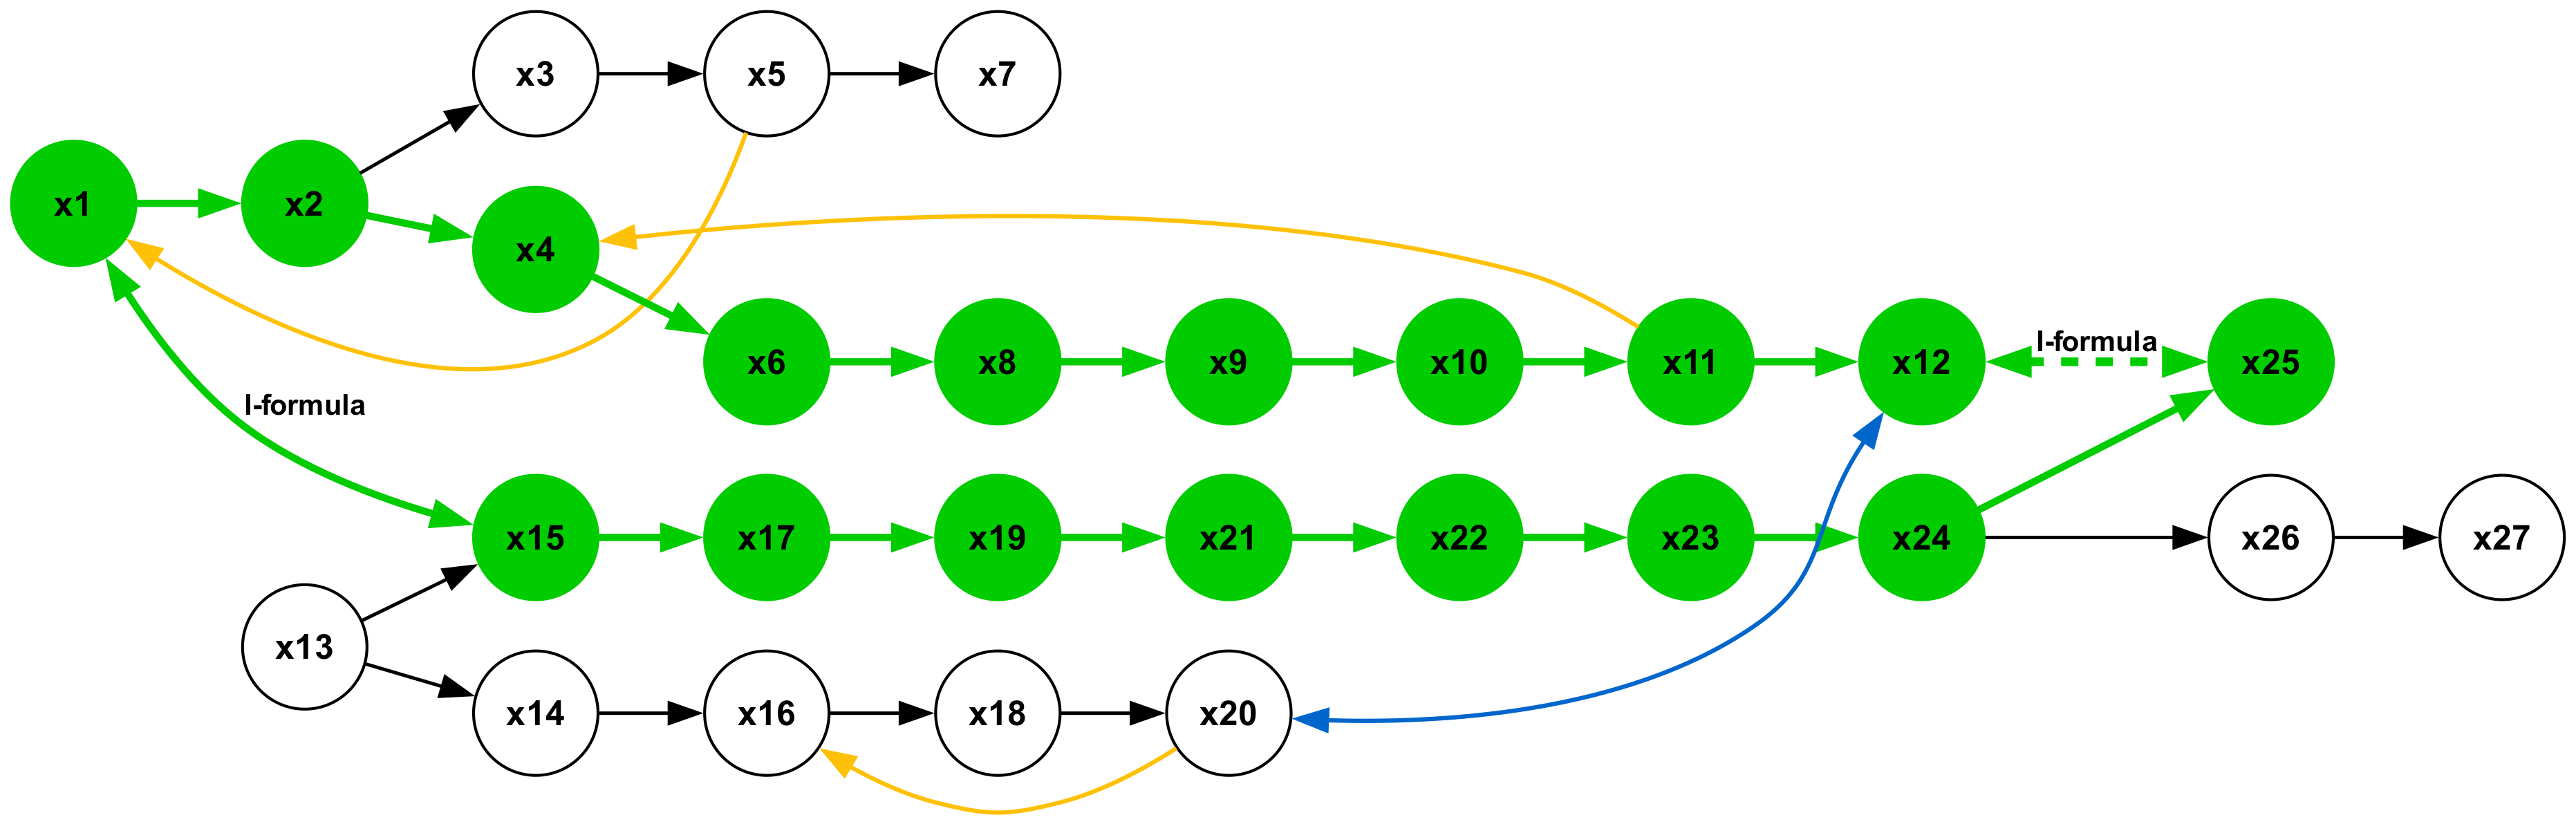
The image depicts a directed graph representing a process flow with 27 nodes labeled 'x1' through 'x27'. The nodes are represented as green circles, and the connections between them are represented by arrows. Two formulas, "l-formula" are indicated as part of the connections. The diagram appears to illustrate dependencies and relationships between variables or stages in a process.
### Components/Axes
The diagram consists of:
* **Nodes:** 27 circular nodes labeled x1 to x27.
* **Edges:** Directed arrows indicating the flow or dependency between nodes.
* **Labels:** "l-formula" appears twice, associated with specific connections.
### Detailed Analysis or Content Details
The diagram can be broken down into several paths:
1. **Path 1:** x1 -> x2 -> x3 -> x5 -> x7
2. **Path 2:** x1 -> x2 -> x4 -> x6 -> x8 -> x9 -> x10 -> x11 -> x12 -> x25
3. **Path 3:** x13 -> x14 -> x16 -> x18 -> x20
4. **Path 4:** x13 -> x15 -> x17 -> x19 -> x21 -> x22 -> x23 -> x24 -> x26 -> x27
5. **Cross Connections:**
* x1 -> x4 (Yellow arrow)
* x2 -> x4 (Yellow arrow)
* x12 -> x25 (Dashed green arrow labeled "l-formula")
* x24 -> x25 (Blue arrow)
The connections are color-coded:
* Green: Most of the connections.
* Yellow: x1 -> x4 and x2 -> x4
* Blue: x24 -> x25
* Dashed Green: x12 -> x25 (labeled "l-formula")
### Key Observations
* Node x1 is a central starting point, branching into two main paths.
* Node x13 is another starting point, initiating two separate paths.
* Node x25 appears to be a convergence point, receiving input from x12 and x24.
* The "l-formula" label suggests a specific calculation or transformation applied to the connection between x12 and x25.
* The diagram does not provide any quantitative data, only the relationships between variables.
### Interpretation
The diagram represents a workflow or a series of calculations where the output of one step feeds into the next. The presence of two starting points (x1 and x13) suggests parallel processing or independent inputs. The convergence at x25 indicates a point where results from different branches are combined. The "l-formula" label highlights a specific operation or transformation applied at that junction.
The diagram is a visual representation of dependencies, and could be used to model a computational process, a business workflow, or a physical system. Without further context, it's difficult to determine the exact meaning of the variables and the operations performed on them. The diagram emphasizes the *structure* of the process rather than the *values* of the variables. The color coding of the arrows may indicate different types of relationships or different processing paths. The use of a dashed line for the "l-formula" connection might indicate a special or less common operation.