## Directed Graph Diagram: System Flow with Feedback Loops
### Overview
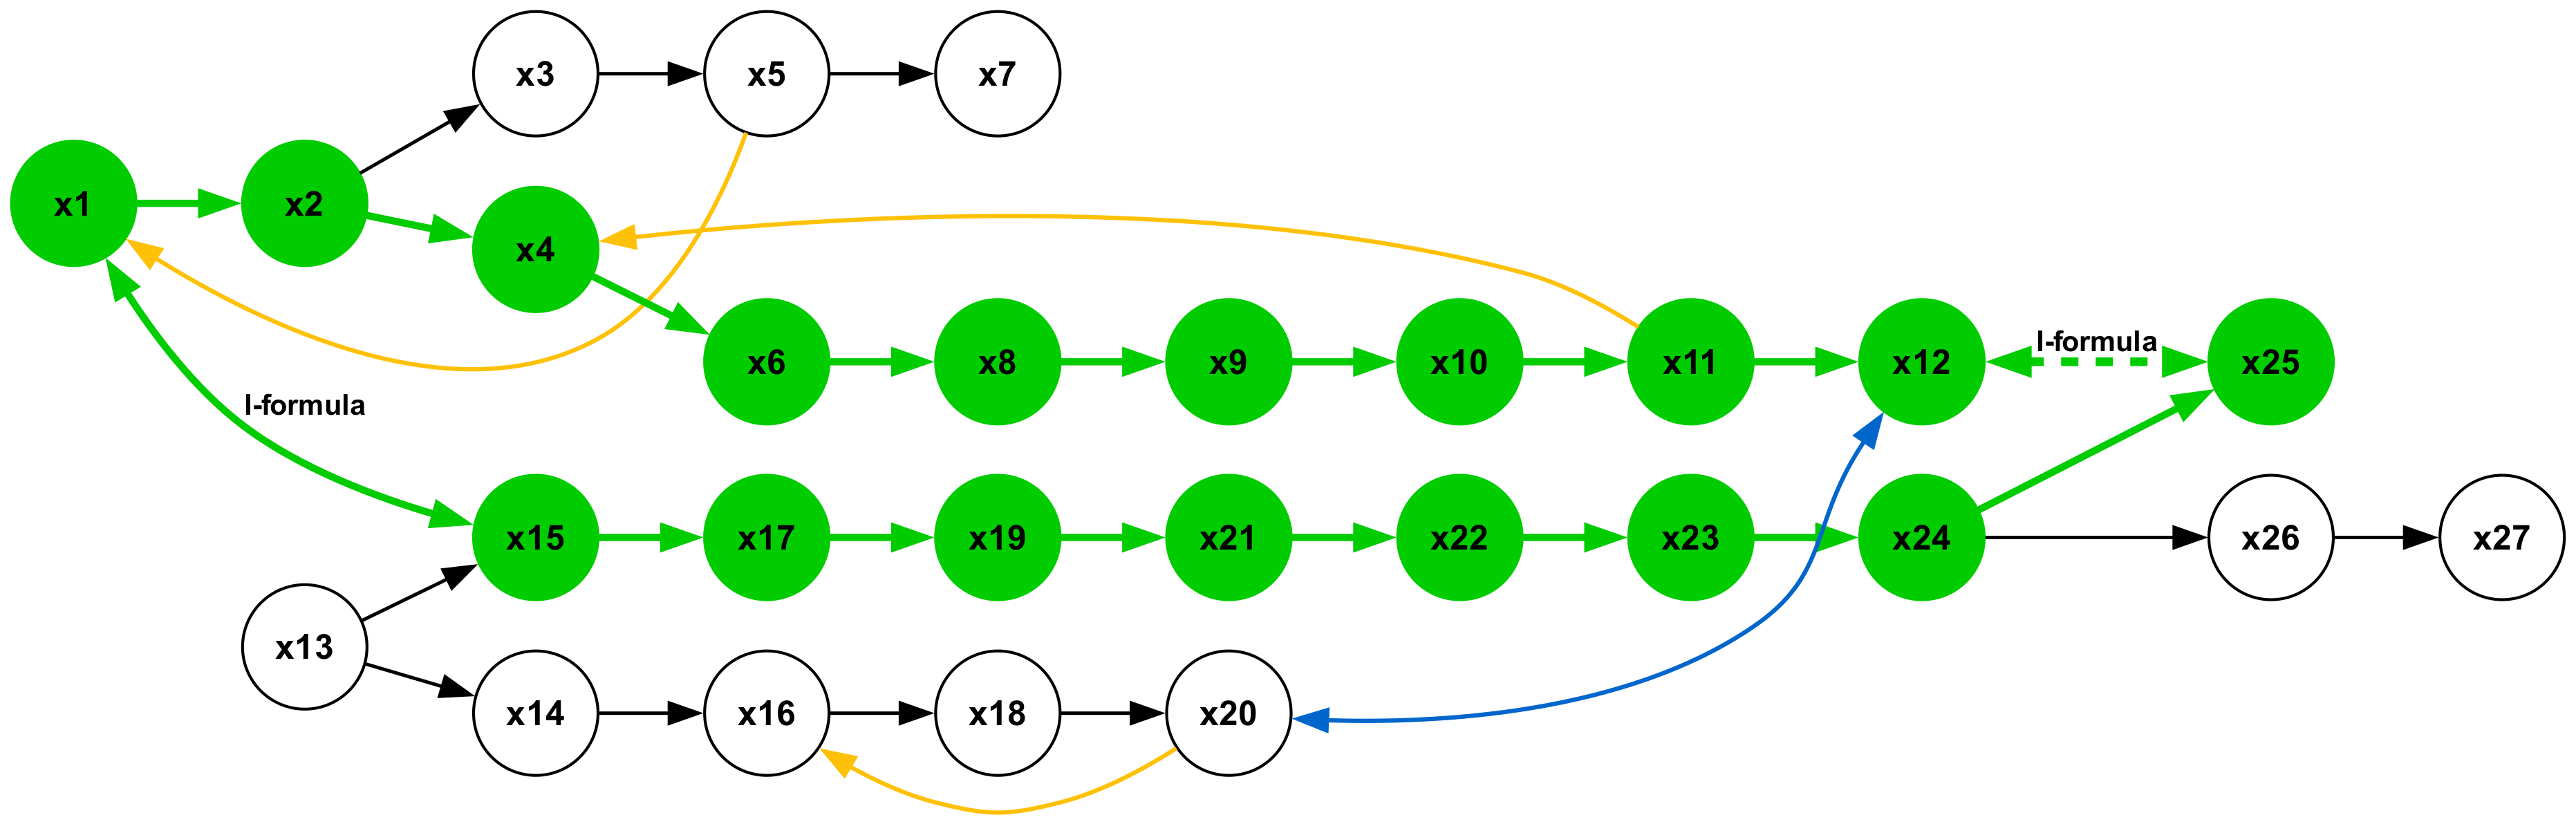
The image displays a directed graph (flowchart) consisting of 27 circular nodes labeled `x1` through `x27`. The nodes are interconnected by directed edges (arrows) of four distinct colors: green, black, yellow, and blue. The diagram illustrates a complex process flow with multiple parallel paths, branching, convergence, and feedback loops. Two edges are explicitly labeled with the text "I-formula".
### Components/Axes
* **Nodes:** 27 circular nodes, each containing a unique label from `x1` to `x27`.
* **Green Nodes (16 total):** `x1`, `x2`, `x4`, `x6`, `x8`, `x9`, `x10`, `x11`, `x12`, `x15`, `x17`, `x19`, `x21`, `x22`, `x23`, `x24`, `x25`.
* **White Nodes (11 total):** `x3`, `x5`, `x7`, `x13`, `x14`, `x16`, `x18`, `x20`, `x26`, `x27`.
* **Edges (Arrows):** Directed connections between nodes, color-coded to indicate different types of relationships or flows.
* **Green Arrows:** Indicate the primary forward flow or main process path.
* **Black Arrows:** Indicate secondary or alternative forward flows.
* **Yellow Arrows:** Indicate feedback loops or backward connections.
* **Blue Arrow:** Indicates a specific, singular feedback connection.
* **Text Labels:** The text "I-formula" appears in two locations:
1. Above a **green dashed arrow** connecting node `x12` to node `x25`.
2. Above a **green arrow** forming a feedback loop from node `x15` back to node `x1`.
### Detailed Analysis
The graph can be segmented into several interconnected regions and paths.
**1. Primary Forward Flow (Green Path):**
This is the most prominent sequence, forming a central "spine" through the diagram.
* **Path:** `x1` → `x2` → `x4` → `x6` → `x8` → `x9` → `x10` → `x11` → `x12`.
* **Trend:** This path flows generally from the left side of the image to the right, with a slight upward then downward curve.
* **Branching from `x12`:**
* A **green dashed arrow** labeled "I-formula" connects `x12` to `x25` (located to its right).
* A **green arrow** connects `x12` to `x24` (located below it).
**2. Upper Branch (White Nodes):**
* **Path:** `x2` → `x3` → `x5` → `x7`.
* **Trend:** This branch splits upward from `x2` and flows horizontally to the right, ending at `x7`.
* **Feedback:** A **yellow arrow** creates a loop from `x5` back to `x4`.
**3. Lower Parallel Flow (Green Path):**
* **Path:** `x15` → `x17` → `x19` → `x21` → `x22` → `x23` → `x24`.
* **Trend:** This path runs parallel to and below the primary flow (`x6`-`x12`), flowing from left to right.
* **Convergence:** This path converges with the primary flow at node `x24`.
**4. Lower Branch (White Nodes):**
* **Path:** `x13` → `x14` → `x16` → `x18` → `x20`.
* **Trend:** This branch splits downward from `x13` and flows horizontally to the right, ending at `x20`.
* **Feedback:** A **yellow arrow** creates a loop from `x20` back to `x16`.
**5. Convergence and Final Paths:**
* **Node `x24`:** Receives input from both the lower green path (`x23`) and the primary green path (`x12`).
* **Paths from `x24`:**
* A **green arrow** goes to `x25`.
* A **black arrow** goes to `x26`, which then connects via another black arrow to `x27`.
* **Node `x25`:** Receives input from both `x12` (via "I-formula" dashed green arrow) and `x24` (via solid green arrow).
**6. Feedback Loops:**
* **Yellow Loop 1:** From `x5` (upper branch) back to `x4` (primary green path).
* **Yellow Loop 2:** From `x20` (lower white branch) back to `x16` (same branch).
* **Green "I-formula" Loop:** From `x15` (lower green path) back to `x1` (start of primary green path).
* **Blue Loop:** A single **blue arrow** from `x24` (convergence point) back to `x20` (end of lower white branch).
### Key Observations
1. **Color-Coded Semantics:** The node color (green vs. white) and edge color (green, black, yellow, blue) are used systematically to differentiate between primary processes, secondary paths, and feedback mechanisms.
2. **Multiple Feedback Mechanisms:** The system contains at least four distinct feedback loops, suggesting it models a process with significant iterative or corrective components.
3. **Convergence Points:** Nodes `x12`, `x24`, and `x25` act as key convergence points where multiple process streams merge.
4. **"I-formula" Significance:** The label "I-formula" is applied to two specific edges: one a forward connection (`x12`→`x25`) and one a major feedback loop (`x15`→`x1`). This suggests a specific rule, calculation, or transformation is applied at these transitions.
5. **Structural Symmetry:** There is a rough symmetry between the upper white branch (`x3`-`x7`) and the lower white branch (`x14`-`x20`), both originating from nodes in the primary green path (`x2` and `x13` respectively) and containing their own feedback loops.
### Interpretation
This diagram likely represents a **complex state machine, workflow, or computational model**. The green nodes and arrows form the core, successful execution path. The white nodes represent auxiliary, optional, or alternative sub-processes that can be triggered from the main path.
The presence of multiple feedback loops (yellow and blue arrows) indicates that the system is not purely linear; it includes mechanisms for iteration, error correction, or resource recycling. The "I-formula" label points to critical decision points or transformation steps governed by a specific formula or rule.
The convergence at `x24` and `x25` suggests these are integration or output stages where results from different process branches are combined. The final black-arrow path to `x27` may represent a terminal or output state.
In essence, the graph models a system where a primary process (`x1`→...→`x12`) can spawn parallel sub-processes, incorporate their results, and use feedback to adjust earlier stages, with specific formulaic operations applied at key junctures.