# Technical Document Extraction: Flowchart Analysis
## Diagram Overview
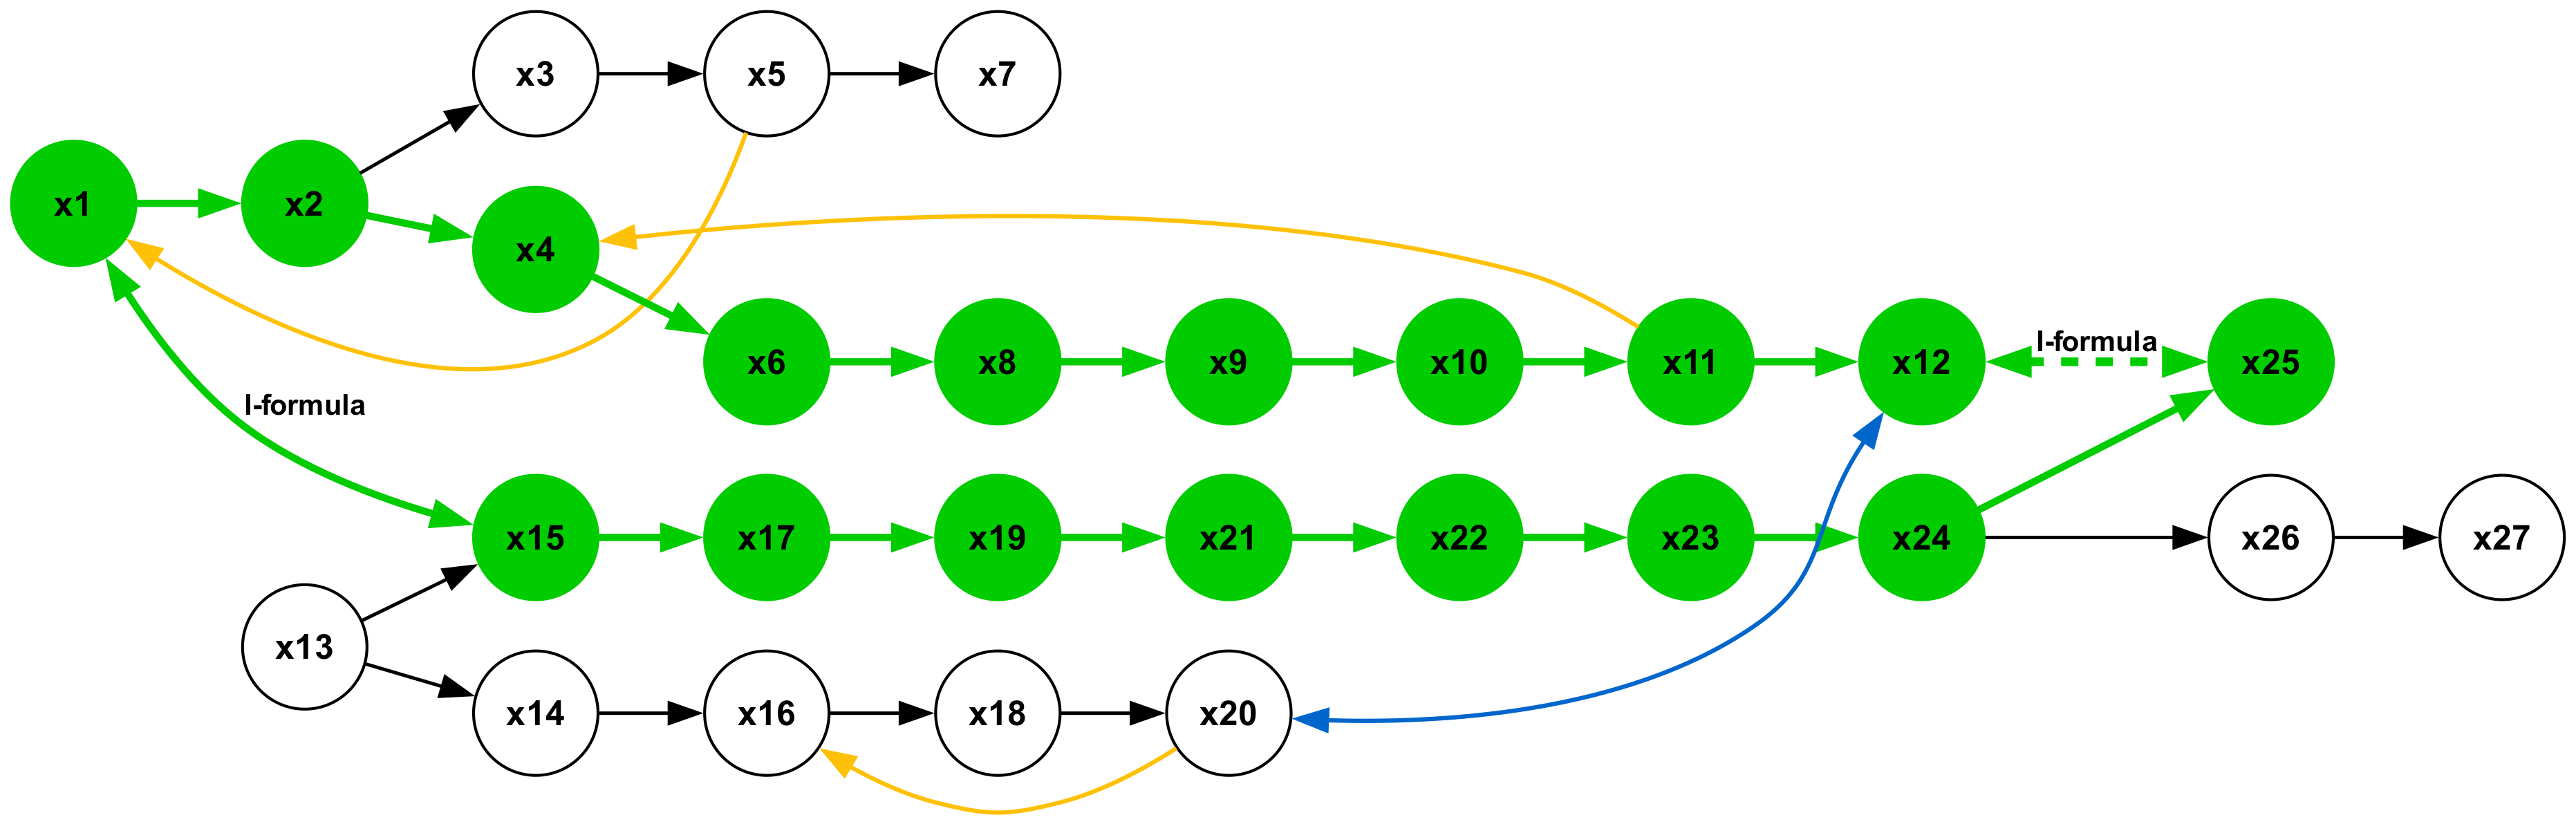
The image depicts a **directed graph** (flowchart) with **27 nodes** labeled `x1` to `x27`. Nodes are color-coded (green and white) and connected via arrows of varying colors (green, yellow, blue, black). Key labels include "I-formula" and a dotted-line feedback loop.
---
## Node Classification
### Green Nodes (Main Process)
- **x1** → **x2** → **x4** → **x6** → **x8** → **x9** → **x10** → **x11** → **x12** → **x25**
- **x15** → **x17** → **x19** → **x21** → **x22** → **x23** → **x24**
- **x25** → **x26** → **x27** (via white nodes)
### White Nodes (Branches/Exceptions)
- **x3** → **x5** → **x7**
- **x13** → **x14** → **x16** → **x18** → **x20**
- **x20** → **x18** (blue feedback loop)
---
## Arrow Analysis
1. **Green Arrows**: Primary flow (e.g., `x1`→`x2`, `x6`→`x8`).
2. **Yellow Arrows**: Conditional/alternative paths (e.g., `x2`→`x4`, `x20`→`x18`).
3. **Blue Arrow**: Feedback loop (`x20`→`x18`).
4. **Black Arrows**: Terminal/end nodes (e.g., `x7`, `x27`).
---
## Key Labels
- **"I-formula"**: Annotated on the green arrow from `x12`→`x25`, indicating a critical computational step.
- **Dotted Line**: Feedback connection from `x25`→`x12`, suggesting iterative processing.
---
## Flow Paths
1. **Primary Path**:
`x1` → `x2` → `x4` → `x6` → `x8` → `x9` → `x10` → `x11` → `x12` → `x25` → `x26` → `x27`.
2. **Branching Paths**:
- `x2` → `x15` → `x17` → `x19` → `x21` → `x22` → `x23` → `x24` → `x25`.
- `x13` → `x14` → `x16` → `x18` → `x20` (with feedback to `x18`).
3. **Exceptional Path**:
`x1` → `x3` → `x5` → `x7` (terminates independently).
---
## Spatial Grounding
- **Legend**: Not explicitly visible in the image.
- **Color Consistency**:
- Green nodes/arrows: Main process.
- White nodes: Branches/exceptions.
- Blue arrow: Feedback loop.
---
## Trend Verification
- **Main Chain (Green Nodes)**: Linear progression from `x1` to `x27` with no upward/downward slope (static flow).
- **Feedback Loop (Blue Arrow)**: Cyclical between `x20` and `x18`.
---
## Component Isolation
1. **Header**: No explicit header; flow begins at `x1`.
2. **Main Chart**: Dominated by green nodes and arrows.
3. **Footer**: Terminal nodes (`x7`, `x27`) and feedback loops.
---
## Missing Elements
- **Data Table**: None present.
- **Axis Titles/Legends**: Not applicable (flowchart, not a chart).
---
## Conclusion
The flowchart represents a **process flow** with conditional branching, feedback loops, and terminal states. The "I-formula" step (`x12`→`x25`) is central to the main process. No numerical data or trends are depicted beyond structural connectivity.