TECHNICAL ASSET FINGERPRINT
4b2598c7a1fe135410551783
Click to view fullscreen
Press ESC or click to close
FOUND IN PAPERS
EXPERT: healer-alpha-free VERSION 1
RUNTIME: free/openrouter/healer-alpha
INTEL_VERIFIED
\n
## Annotated Aerial Photograph: Object Detection Overlay
### Overview
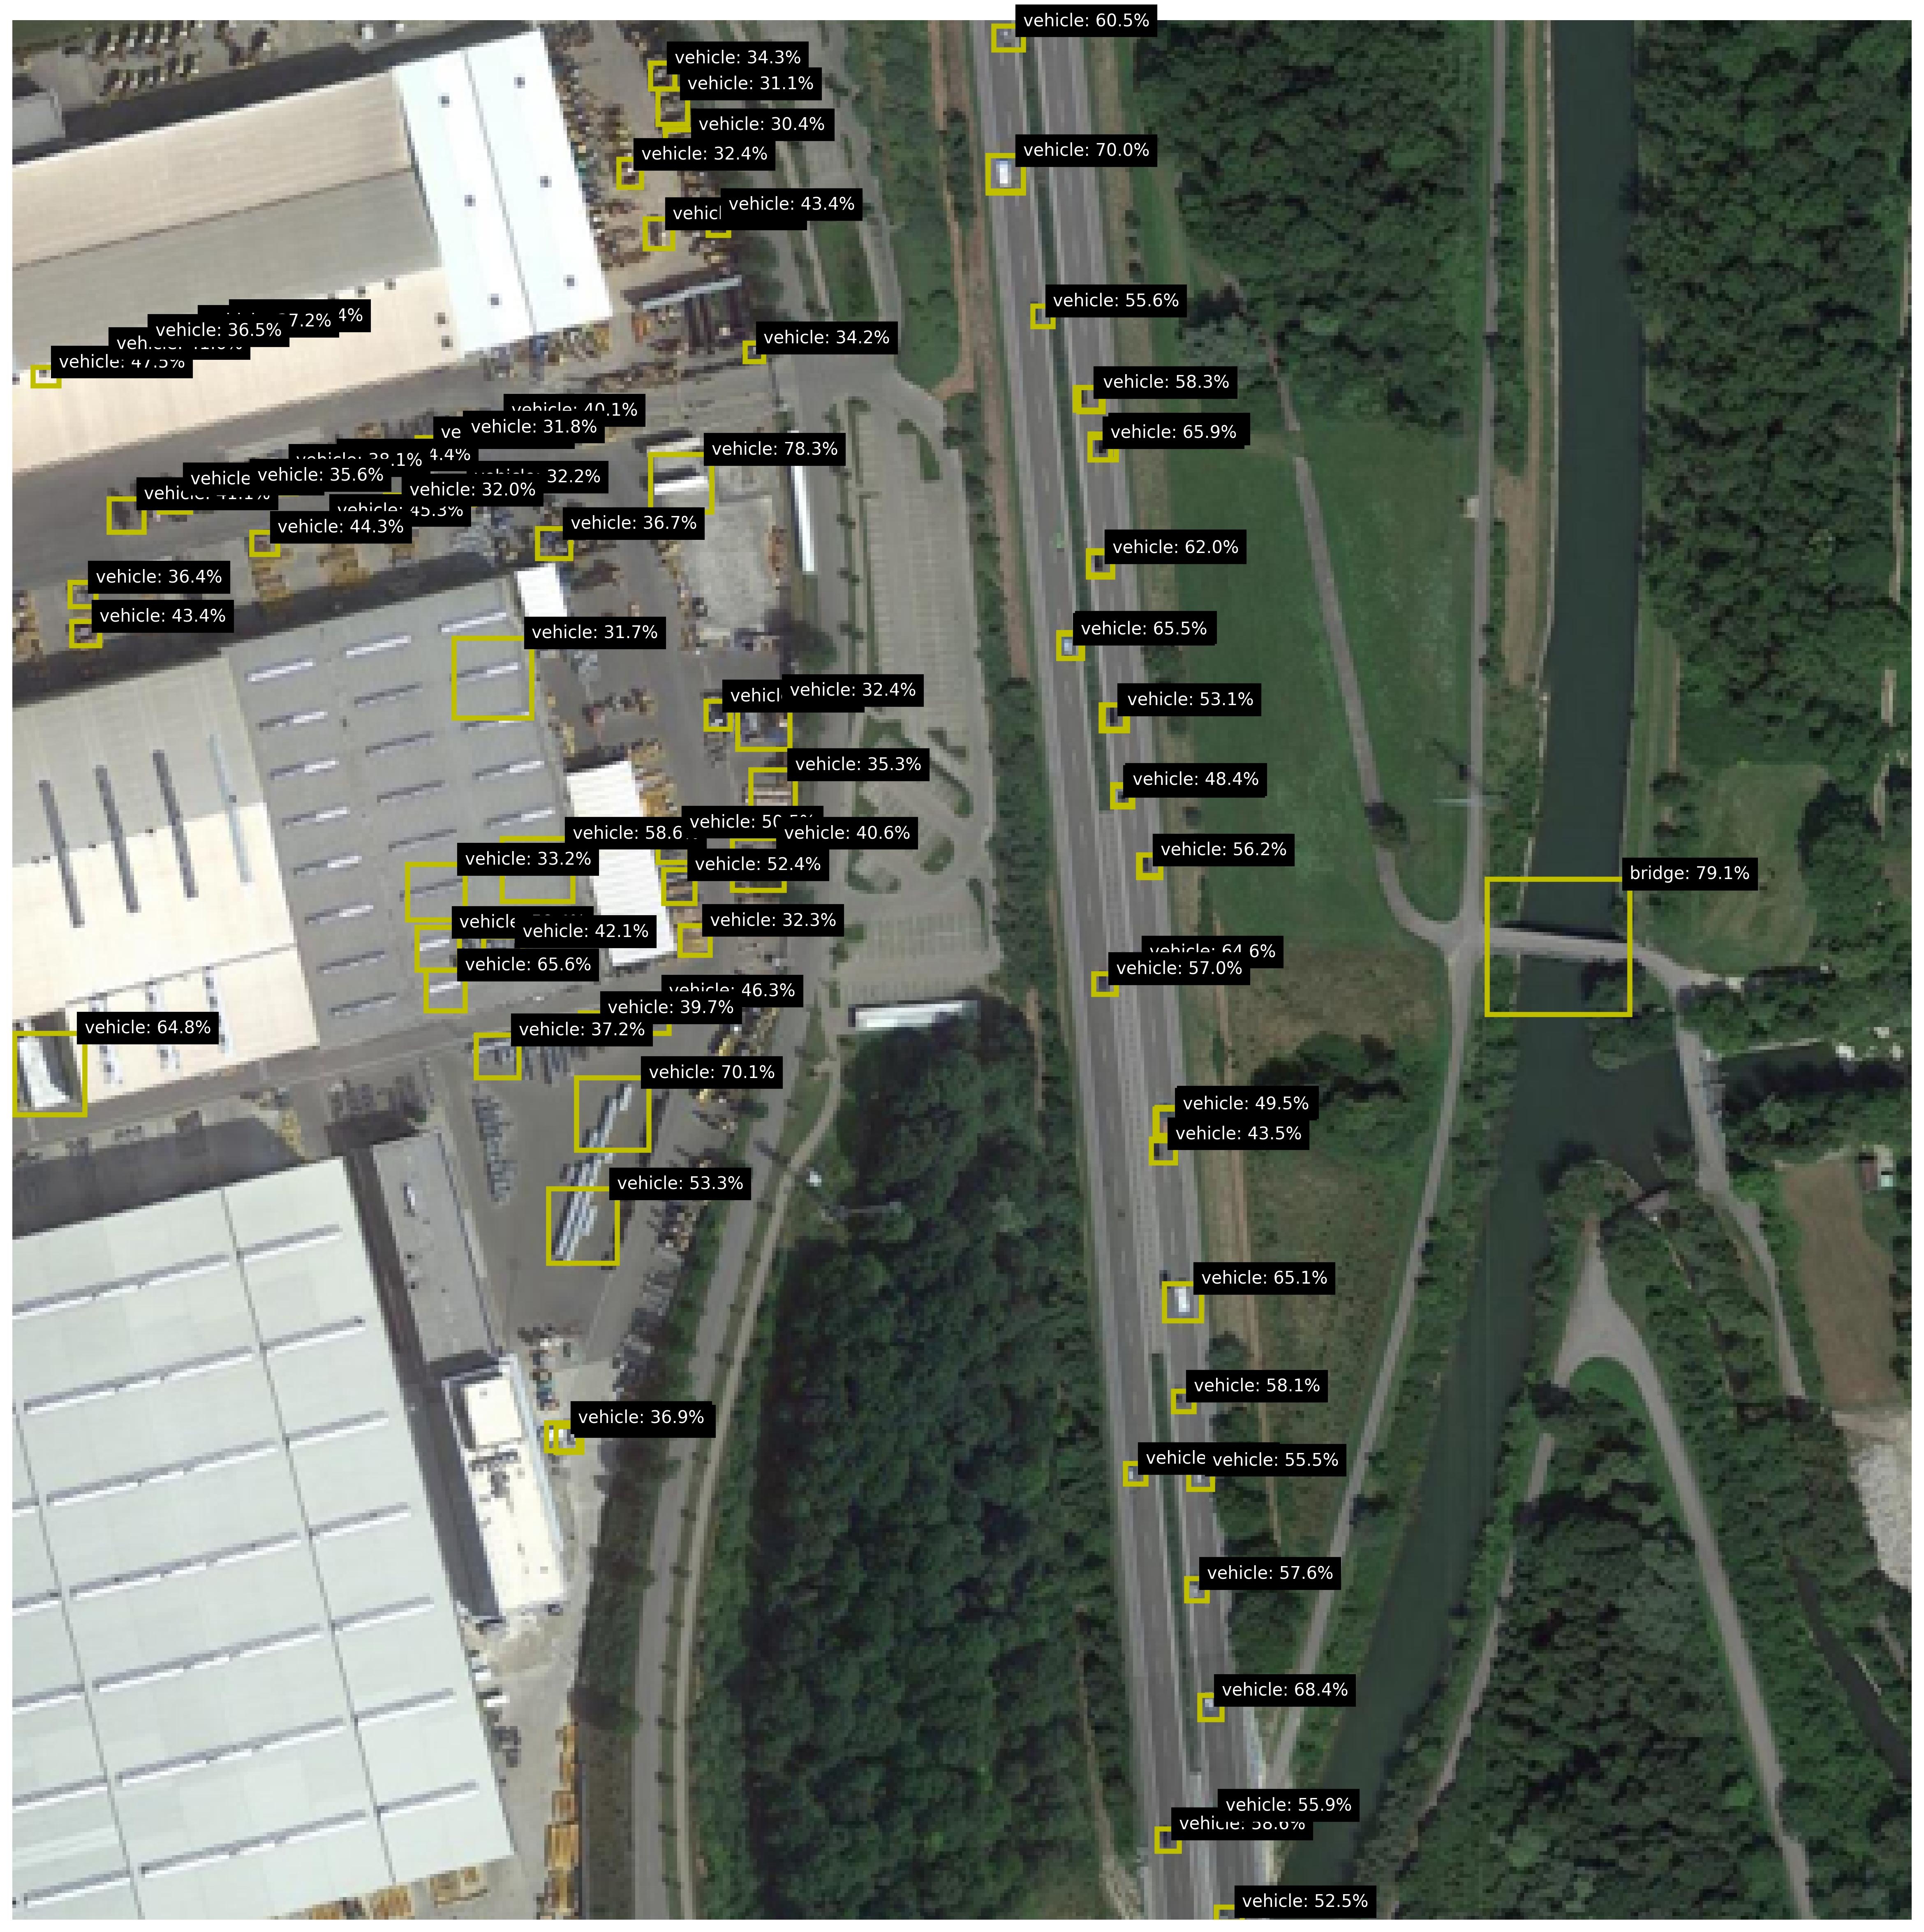
This image is a high-resolution aerial or satellite photograph of an industrial and transportation area, overlaid with the results of an object detection algorithm. The algorithm has placed yellow bounding boxes around identified objects, each accompanied by a black label with white text stating the object class and a confidence percentage. The scene includes large industrial buildings, parking lots, a multi-lane highway, a river or canal, and forested areas.
### Components/Axes
* **Image Type:** Annotated aerial photograph.
* **Annotation System:**
* **Bounding Boxes:** Yellow rectangles outlining detected objects.
* **Labels:** Black rectangular tags with white text, positioned near their corresponding bounding box.
* **Data Format:** `[object class]: [confidence score]%`
* **Detected Object Classes:**
1. `vehicle`
2. `bridge`
* **Scene Layout (Spatial Grounding):**
* **Top-Left Quadrant:** Large industrial complex with multiple buildings, loading docks, and a dense parking lot filled with detected vehicles.
* **Center-Left:** More industrial buildings and parking areas.
* **Center-Right:** A multi-lane highway running vertically, with vehicles detected in the lanes.
* **Right Side:** A river or canal running parallel to the highway, crossed by a detected bridge. The far right is densely forested.
* **Bottom:** Continuation of the industrial area and highway.
### Detailed Analysis
**1. Vehicle Detections:**
Vehicles are detected in three primary clusters with varying confidence levels.
* **Cluster 1: Industrial Parking Lot (Top-Left)**
* **Density:** Very high. Dozens of vehicles are packed closely together.
* **Confidence Range:** Approximately 30% to 78%.
* **Sample Values (from top, moving down and right):**
* `vehicle: 34.3%`, `vehicle: 31.1%`, `vehicle: 30.4%`, `vehicle: 32.4%`
* `vehicle: 43.4%`, `vehicle: 34.2%`
* `vehicle: 78.3%` (Notably high confidence in this cluster)
* `vehicle: 36.7%`, `vehicle: 32.0%`, `vehicle: 44.3%`, `vehicle: 36.4%`, `vehicle: 43.4%`
* `vehicle: 31.7%`, `vehicle: 32.4%`, `vehicle: 35.3%`
* `vehicle: 58.6%`, `vehicle: 52.4%`, `vehicle: 40.6%`, `vehicle: 33.2%`, `vehicle: 42.1%`, `vehicle: 65.6%`
* `vehicle: 46.3%`, `vehicle: 39.7%`, `vehicle: 37.2%`, `vehicle: 70.1%`
* `vehicle: 53.3%`, `vehicle: 36.9%`
* `vehicle: 64.8%` (On a building roof, possibly a parked truck)
* **Cluster 2: Highway (Center-Right)**
* **Density:** Moderate. Vehicles are spaced apart in travel lanes.
* **Confidence Range:** Approximately 43% to 70%.
* **Sample Values (from top to bottom along the highway):**
* `vehicle: 60.5%`, `vehicle: 70.0%`
* `vehicle: 55.6%`, `vehicle: 58.3%`, `vehicle: 65.9%`
* `vehicle: 62.0%`, `vehicle: 65.5%`
* `vehicle: 53.1%`, `vehicle: 48.4%`, `vehicle: 56.2%`
* `vehicle: 57.0%`, `vehicle: 64.6%`
* `vehicle: 49.5%`, `vehicle: 43.5%`
* `vehicle: 65.1%`, `vehicle: 58.1%`
* `vehicle: 55.5%`, `vehicle: 57.6%`
* `vehicle: 68.4%`, `vehicle: 55.9%`, `vehicle: 50.6%`, `vehicle: 52.5%`
* **Cluster 3: Scattered/Other Areas**
* A few isolated detections, such as `vehicle: 36.5%` and `vehicle: 47.3%` near the top-left edge.
**2. Bridge Detection:**
* **Location:** Center-right, spanning the river/canal.
* **Detection:** `bridge: 79.1%`
* **Note:** This is the only non-vehicle object detected and has one of the highest confidence scores in the entire image.
### Key Observations
1. **Confidence Disparity:** There is a clear trend in confidence scores based on location. Vehicles on the open highway (Cluster 2) generally have higher confidence scores (mostly 50-70%) compared to those in the densely packed parking lot (Cluster 1), where scores are often in the 30-40% range. This suggests the model performs better on isolated, clearly defined objects against a simple background (asphalt road) than on clustered, partially occluded objects.
2. **High-Confidence Outliers:** Two detections stand out with ~78-79% confidence: one `vehicle` in the parking lot and the `bridge`. The bridge's high score indicates the model is very certain about this large, structurally distinct object.
3. **Detection Density:** The highest density of detections is in the industrial parking area, indicating significant vehicle storage or activity. The highway shows steady, moderate traffic flow.
4. **False Positive/Negative Potential:** The image does not show the original source, so it's impossible to confirm if all vehicles are detected (false negatives) or if any boxes are incorrect (false positives). However, the `vehicle: 64.8%` detection on a building roof could be a potential false positive if that object is not a vehicle.
### Interpretation
This image demonstrates the output of a computer vision model trained for object detection in aerial imagery. The data suggests the following:
* **Model Performance Context:** The model's confidence is context-dependent. It excels at identifying clear, singular infrastructure objects (the bridge) and vehicles on roads. Its performance degrades in complex, cluttered scenes like a packed parking lot, where object boundaries are less distinct.
* **Scene Activity:** The area is an active industrial/logistics zone with substantial vehicle storage and through-traffic on a major highway. The bridge is a key piece of infrastructure connecting the two sides of the waterway.
* **Utility:** Such data could be used for automated traffic monitoring, parking lot occupancy estimation, infrastructure mapping, or training data for improving AI models. The confidence scores are crucial for filtering results; a user might only trust detections above a certain threshold (e.g., 50%) for reliable analysis.
* **Investigative Reading (Peircean):** The pattern of detections forms an *index* of the scene's function. The cluster of low-confidence vehicles points to a storage yard. The line of medium-confidence vehicles points to a transit corridor. The single high-confidence bridge points to a critical choke point. Together, they paint a picture of a transportation and industrial hub. The variance in confidence is itself data, revealing the model's "uncertainty landscape" across different terrains.
DECODING INTELLIGENCE...