## Aerial Photograph with Vehicle and Bridge Annotations
### Overview
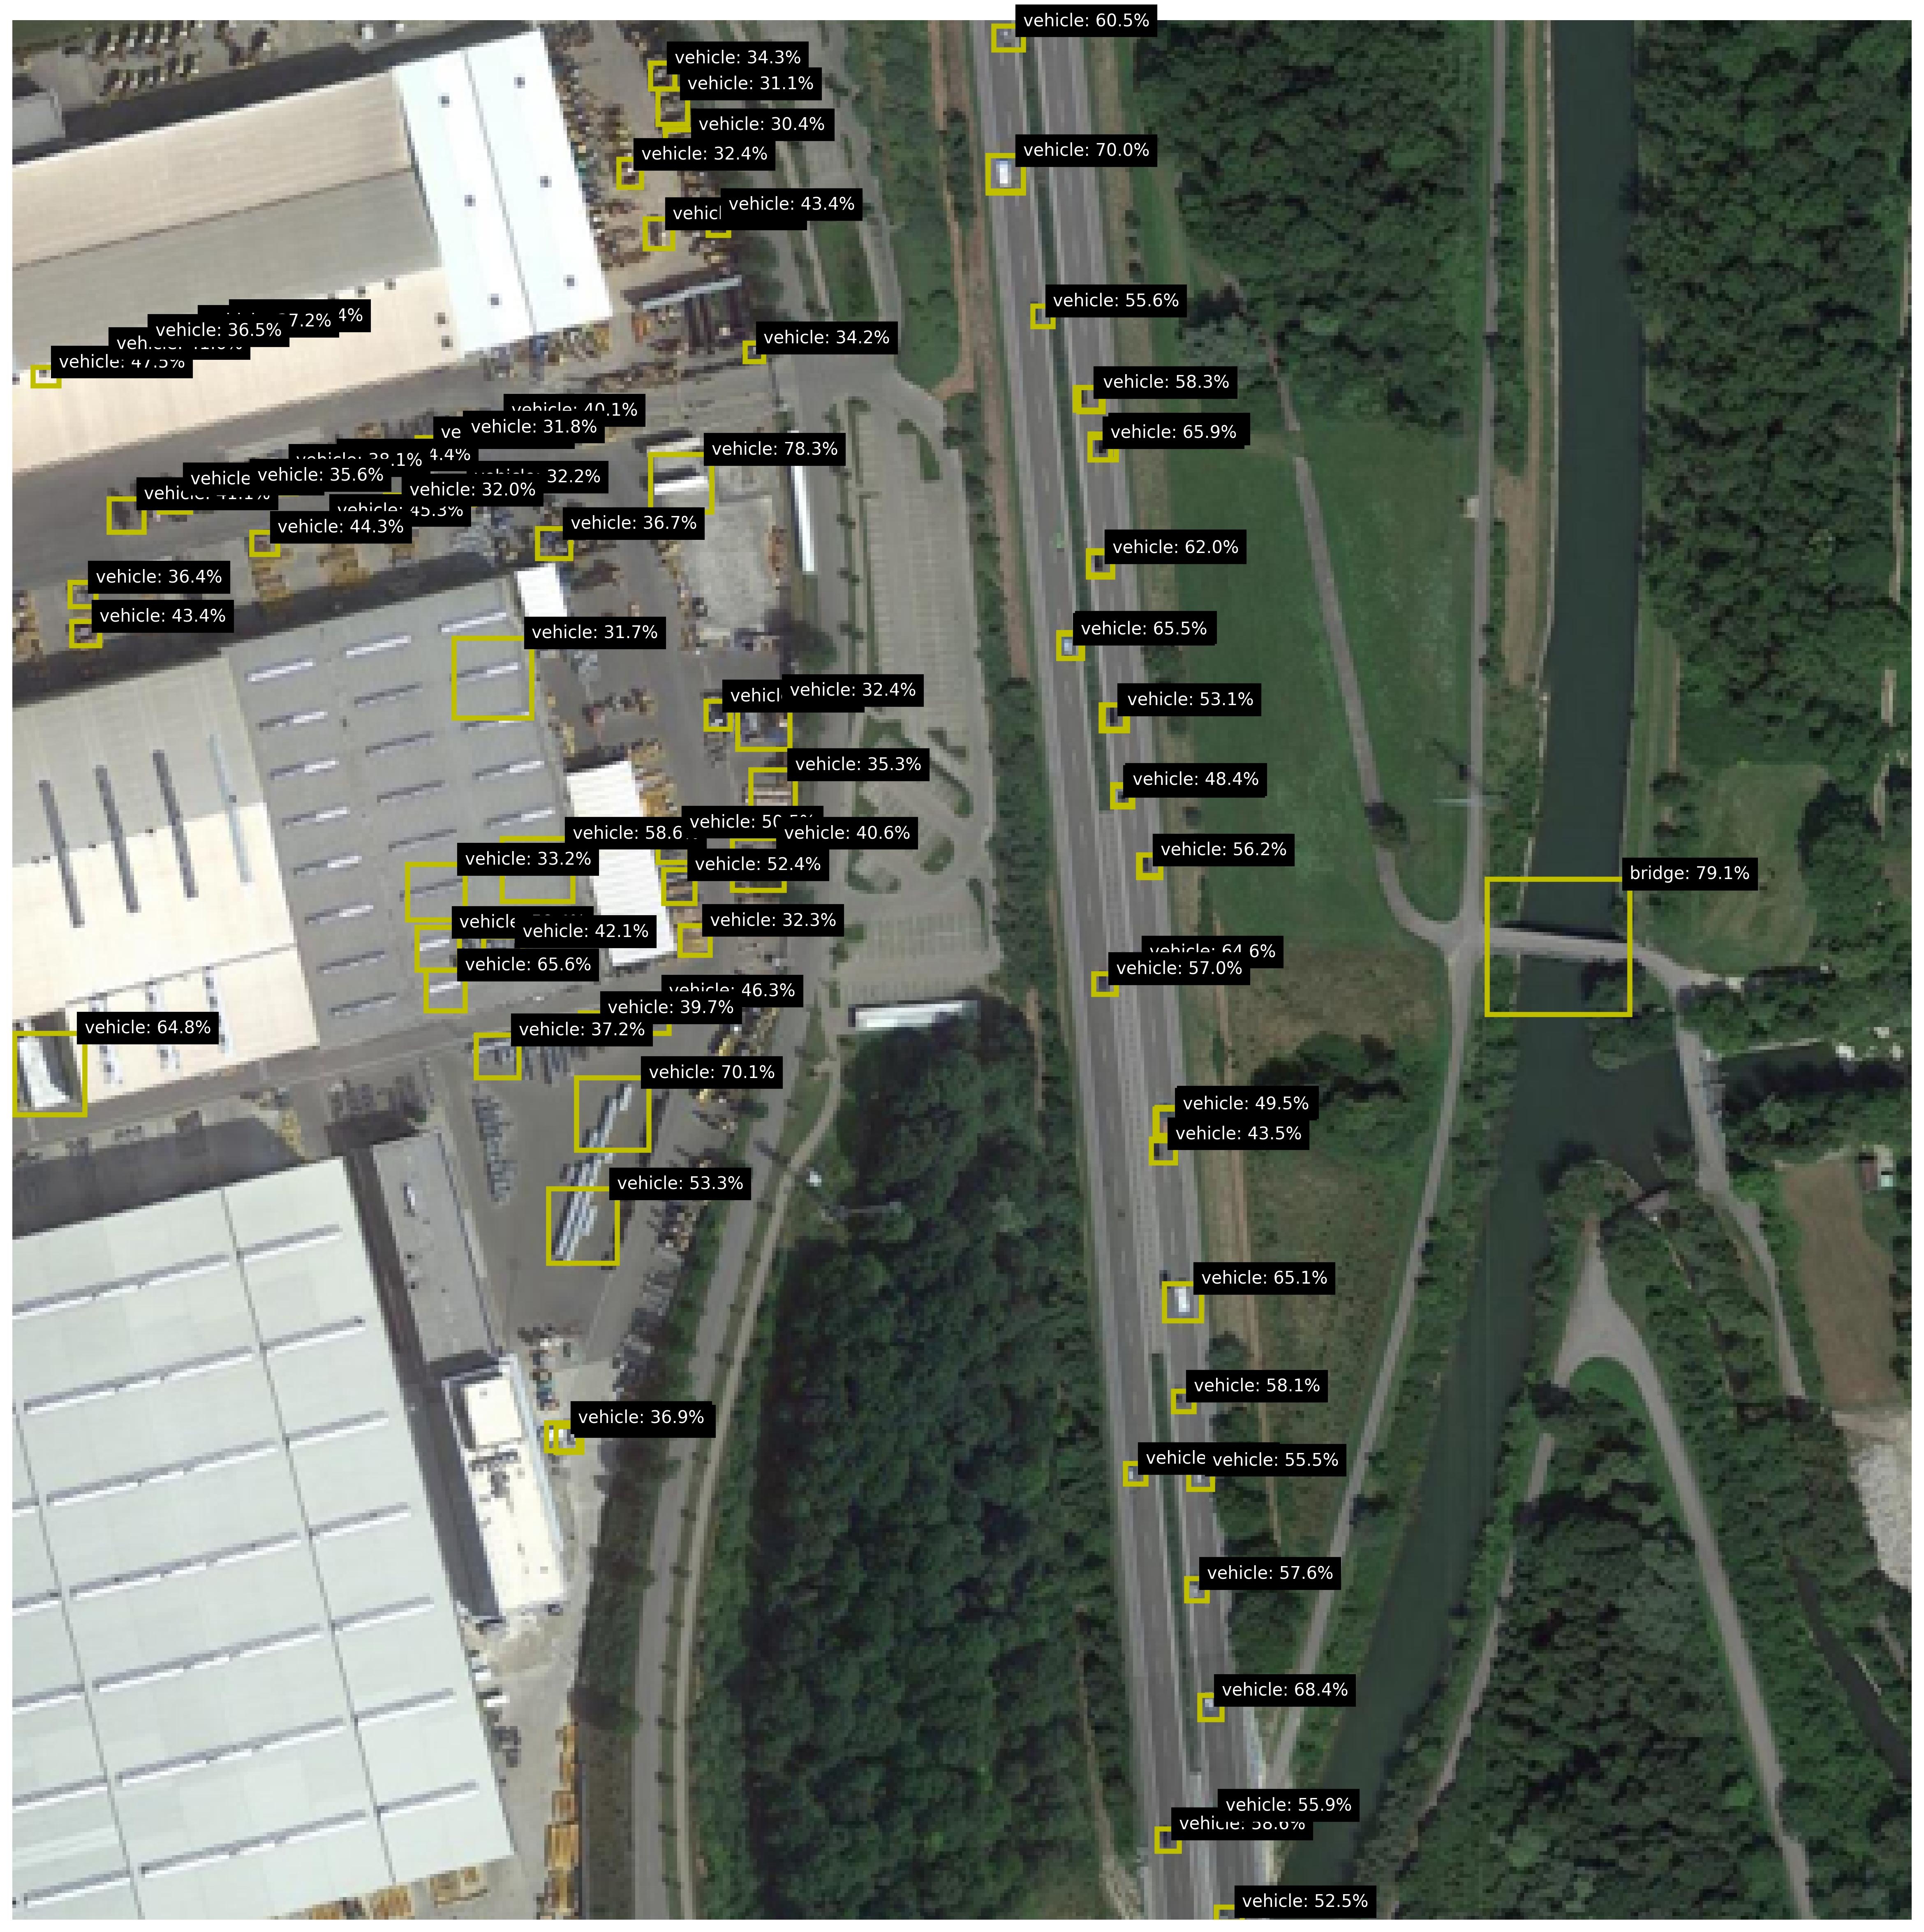
The image is an aerial view of an industrial complex, highway, river, and surrounding greenery. Yellow bounding boxes with percentage labels (e.g., "vehicle: 36.5%", "bridge: 79.1%") are overlaid on specific objects. The annotations appear to represent confidence scores or detection metrics, though no legend or context is provided.
### Components/Axes
- **Primary Elements**:
- Industrial complex (left side, large white/gray buildings).
- Highway (vertical road, center-right).
- River (dark blue, right side).
- Green spaces (trees, grass, bottom-right).
- **Annotations**:
- Yellow bounding boxes with black text (e.g., "vehicle: X.X%").
- One box labeled "bridge: 79.1%".
- **No explicit legend, axes, or scales**.
### Detailed Analysis
- **Vehicle Annotations**:
- Percentages range from **7.2% to 78.3%**, with most clustered between **30% and 60%**.
- Examples:
- Top-left industrial area: "vehicle: 36.5%", "vehicle: 47.3%".
- Highway: "vehicle: 60.5%", "vehicle: 70.0%".
- Bottom-right: "vehicle: 52.5%", "vehicle: 68.4%".
- Some labels are partially cut off (e.g., "vehicle: 36.5%" at the top-left edge).
- **Bridge Annotation**:
- Located on the right side, spanning the river.
- Label: "bridge: 79.1%".
### Key Observations
1. **Highest Confidence**: The bridge has the highest percentage (79.1%), suggesting it may be a focal point or larger object.
2. **Vehicle Density**: The industrial complex and highway have the most vehicle annotations, indicating higher activity or detection focus.
3. **Spatial Distribution**:
- Vehicles are annotated predominantly on paved surfaces (highway, parking lots).
- Fewer annotations in green areas (riverbanks, forests).
4. **Ambiguity**: No clear explanation for the percentages (e.g., detection confidence, object size, or classification accuracy).
### Interpretation
- The annotations likely represent a computer vision model’s confidence scores for object detection (e.g., vehicles, bridges).
- The bridge’s high score (79.1%) may reflect its size or structural distinctiveness compared to smaller vehicles.
- The industrial complex and highway show varied vehicle percentages, possibly due to differences in object density, size, or model performance in complex scenes.
- The lack of a legend or contextual metadata limits interpretation of the percentages’ exact meaning.
## Notes
- All text is in English.
- No data tables, charts, or diagrams present.
- Percentages are approximate and lack uncertainty ranges.
- Spatial grounding confirms annotations align with physical objects (e.g., bridge spans the river).