# Technical Document Extraction: Model Hallucination Ratio Comparison
## 1. Component Isolation
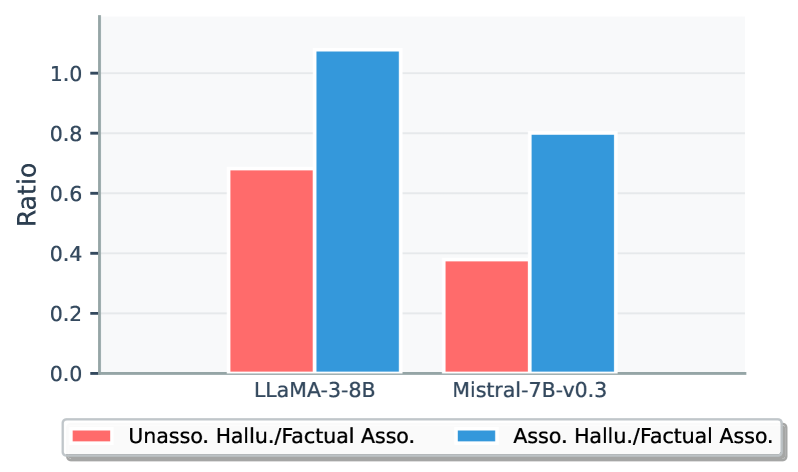
* **Header:** None present.
* **Main Chart Area:** A grouped bar chart comparing two Large Language Models (LLMs) across two specific metrics.
* **Footer/Legend:** Located at the bottom center, containing two color-coded categories.
## 2. Axis and Label Extraction
* **Y-Axis Title:** "Ratio" (Vertical orientation).
* **Y-Axis Markers:** 0.0, 0.2, 0.4, 0.6, 0.8, 1.0 (Linear scale with light grey horizontal grid lines).
* **X-Axis Categories:**
* **LLaMA-3-8B**
* **Mistral-7B-v0.3**
* **Legend Labels (Spatial Grounding: Bottom Center):**
* **Red Bar:** "Unasso. Hallu./Factual Asso." (Unassociated Hallucination / Factual Association)
* **Blue Bar:** "Asso. Hallu./Factual Asso." (Associated Hallucination / Factual Association)
## 3. Data Table Reconstruction
Based on the visual alignment with the Y-axis grid lines, the following values are extracted:
| Model | Unasso. Hallu./Factual Asso. (Red) | Asso. Hallu./Factual Asso. (Blue) |
| :--- | :---: | :---: |
| **LLaMA-3-8B** | ~0.68 | ~1.08 |
| **Mistral-7B-v0.3** | ~0.38 | ~0.80 |
## 4. Trend Verification and Analysis
* **Trend 1 (Inter-Model Comparison):** Mistral-7B-v0.3 exhibits lower ratios across both metrics compared to LLaMA-3-8B. Specifically, the red bar for Mistral is significantly lower (nearly half) than that of LLaMA.
* **Trend 2 (Intra-Model Comparison):** For both models, the "Associated Hallucination" ratio (Blue) is consistently higher than the "Unassociated Hallucination" ratio (Red).
* **Trend 3 (Magnitude):** LLaMA-3-8B's blue bar is the only data point exceeding the 1.0 ratio mark, indicating that associated hallucinations occur more frequently than factual associations in this specific context.
## 5. Detailed Description
This image is a grouped bar chart titled by its axes as a "Ratio" comparison between two AI models: **LLaMA-3-8B** and **Mistral-7B-v0.3**.
The chart uses a light grey background with horizontal grid lines every 0.2 units. The data is presented in two clusters. The first cluster (LLaMA-3-8B) shows a red bar reaching approximately 0.68 and a blue bar reaching approximately 1.08. The second cluster (Mistral-7B-v0.3) shows a red bar reaching approximately 0.38 and a blue bar reaching exactly 0.80.
The legend indicates that the red bars represent the ratio of unassociated hallucinations to factual associations, while the blue bars represent the ratio of associated hallucinations to factual associations. The overall data suggests that Mistral-7B-v0.3 performs better (lower hallucination ratios) than LLaMA-3-8B in both measured categories.