## Grouped Bar Chart: Hallucination Ratios for Two Language Models
### Overview
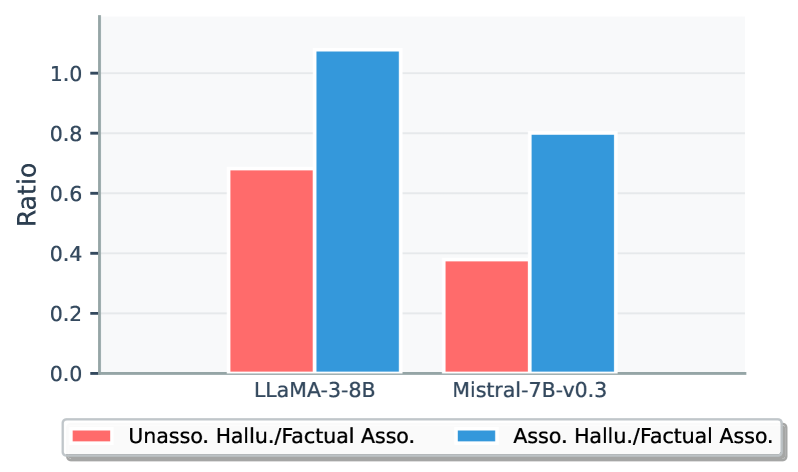
The image displays a grouped bar chart comparing two metrics related to hallucinations and factual associations for two large language models: LLaMA-3-8B and Mistral-7B-v0.3. The chart visualizes the ratio of "Unassociated Hallucinations to Factual Associations" and "Associated Hallucinations to Factual Associations" for each model.
### Components/Axes
* **Chart Type:** Grouped Bar Chart.
* **X-Axis (Categories):** Two primary categories representing different AI models.
* Left Group: `LLaMA-3-8B`
* Right Group: `Mistral-7B-v0.3`
* **Y-Axis (Scale):** Labeled `Ratio`. The scale is linear, ranging from 0.0 to just above 1.0, with major tick marks at 0.0, 0.2, 0.4, 0.6, 0.8, and 1.0.
* **Legend:** Positioned at the bottom center of the chart. It defines the two data series:
* **Red Bar:** `Unasso. Hallu./Factual Asso.` (Abbreviation for "Unassociated Hallucinations / Factual Associations")
* **Blue Bar:** `Asso. Hallu./Factual Asso.` (Abbreviation for "Associated Hallucinations / Factual Asso.")
* **Data Series:** Each model category on the x-axis contains two adjacent bars corresponding to the legend.
### Detailed Analysis
**1. LLaMA-3-8B (Left Group):**
* **Red Bar (Unasso. Hallu./Factual Asso.):** The bar height is approximately **0.68**. The visual trend shows a moderate ratio.
* **Blue Bar (Asso. Hallu./Factual Asso.):** The bar height is the tallest in the chart, extending slightly above the 1.0 grid line. The approximate value is **1.05**. The visual trend is a significant increase compared to its paired red bar.
**2. Mistral-7B-v0.3 (Right Group):**
* **Red Bar (Unasso. Hallu./Factual Asso.):** The bar height is approximately **0.38**. This is the lowest value in the chart.
* **Blue Bar (Asso. Hallu./Factual Asso.):** The bar height is approximately **0.80**. The visual trend shows a substantial increase compared to its paired red bar.
**Trend Verification:**
* For both models, the blue bar ("Associated Hallucinations/Factual Associations") is consistently and significantly taller than the red bar ("Unassociated Hallucinations/Factual Associations").
* LLaMA-3-8B exhibits higher ratios for both metrics compared to Mistral-7B-v0.3.
### Key Observations
1. **Consistent Pattern:** Across both models, the ratio of Associated Hallucinations to Factual Associations is higher than the ratio of Unassociated Hallucinations to Factual Associations.
2. **Model Comparison:** LLaMA-3-8B shows higher values for both metrics than Mistral-7B-v0.3.
3. **Notable Outlier:** The "Asso. Hallu./Factual Asso." ratio for LLaMA-3-8B exceeds 1.0 (≈1.05). This is the only data point above the 1.0 threshold.
4. **Relative Difference:** The proportional increase from the red to the blue bar appears more pronounced for LLaMA-3-8B than for Mistral-7B-v0.3.
### Interpretation
This chart presents a comparative analysis of how two language models generate hallucinations in relation to factual associations. The data suggests a fundamental difference in behavior between "associated" and "unassociated" hallucinations.
* **What the data suggests:** The consistently higher blue bars indicate that for both models, hallucinations that are *associated* with the factual context are more frequent (relative to the number of factual associations) than hallucinations that are *unassociated*. This could imply that models are more prone to generating plausible-sounding but incorrect information that is topically related to the factual content, rather than generating completely unrelated falsehoods.
* **Model Behavior:** LLaMA-3-8B's ratio exceeding 1.0 for associated hallucinations is particularly noteworthy. It suggests that, for this model and this specific metric, the count of associated hallucinations may be on par with or even exceed the count of factual associations in the evaluated context. This could point to a higher propensity for this type of error in LLaMA-3-8B compared to Mistral-7B-v0.3 under the test conditions.
* **Relationship Between Elements:** The chart directly contrasts two error types (associated vs. unassociated hallucinations) across two models. The grouping allows for both intra-model comparison (red vs. blue for one model) and inter-model comparison (same color across models). The clear visual separation emphasizes that the observed pattern (blue > red) is model-agnostic, while the absolute values differ.
* **Anomaly:** The value >1.0 for LLaMA-3-8B's associated hallucination ratio is the primary anomaly. It warrants further investigation into the evaluation methodology, the definition of "association," and the specific failure modes of that model.