## Bar Chart: Unasso. Hallu./Factual Asso. vs. Asso. Hallu./Factual Asso.
### Overview
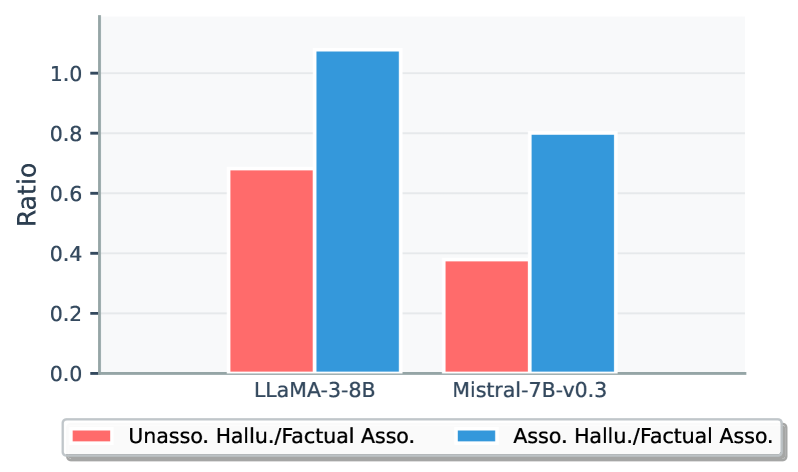
The chart compares two language models, **LLaMA-3-8B** and **Mistral-7B-v0.3**, across two categories: **Unasso. Hallu./Factual Asso.** (unassociated hallucination/factual association) and **Asso. Hallu./Factual Asso.** (associated hallucination/factual association). The y-axis represents a **Ratio** (0.0–1.0), while the x-axis lists the models.
### Components/Axes
- **X-axis**: Models (`LLaMA-3-8B`, `Mistral-7B-v0.3`).
- **Y-axis**: Ratio (0.0–1.0, increments of 0.2).
- **Legend**:
- **Red**: Unasso. Hallu./Factual Asso.
- **Blue**: Asso. Hallu./Factual Asso.
- **Title**: "Unasso. Hallu./Factual Asso. Asso. Hallu./Factual Asso." (positioned above the chart).
### Detailed Analysis
1. **LLaMA-3-8B**:
- **Unasso. Hallu./Factual Asso.** (red): ~0.65.
- **Asso. Hallu./Factual Asso.** (blue): ~1.05 (slightly exceeding the y-axis maximum of 1.0).
2. **Mistral-7B-v0.3**:
- **Unasso. Hallu./Factual Asso.** (red): ~0.38.
- **Asso. Hallu./Factual Asso.** (blue): ~0.8.
### Key Observations
- Both models show **higher ratios for Asso. Hallu./Factual Asso.** compared to Unasso. Hallu./Factual Asso., indicating improved performance when associated.
- **LLaMA-3-8B** exhibits a **larger increase** (~0.4 increase) in the Asso. category compared to Mistral-7B-v0.3 (~0.42 increase).
- The blue bars (Asso.) consistently dominate the red bars (Unasso.) for both models.
### Interpretation
The data suggests that **association improves factual performance** for both models, but **LLaMA-3-8B** demonstrates a more pronounced benefit from association. This could imply that LLaMA-3-8B is more sensitive to contextual or associative cues in factual tasks. The slight overflow of LLaMA-3-8B’s Asso. bar beyond 1.0 may indicate an outlier or measurement artifact, warranting further validation.
### Spatial Grounding & Verification
- Legend is positioned at the **bottom-center**, clearly mapping colors to categories.
- Red bars (Unasso.) are shorter than blue bars (Asso.) for both models, confirming the legend’s accuracy.
- Y-axis labels and increments are evenly spaced, ensuring reliable ratio interpretation.
### Content Details
- No additional text or embedded data tables are present.
- All values are approximate due to the absence of exact numerical annotations on the bars.