# Technical Document Extraction: Roofline Model Analysis
## Chart Title
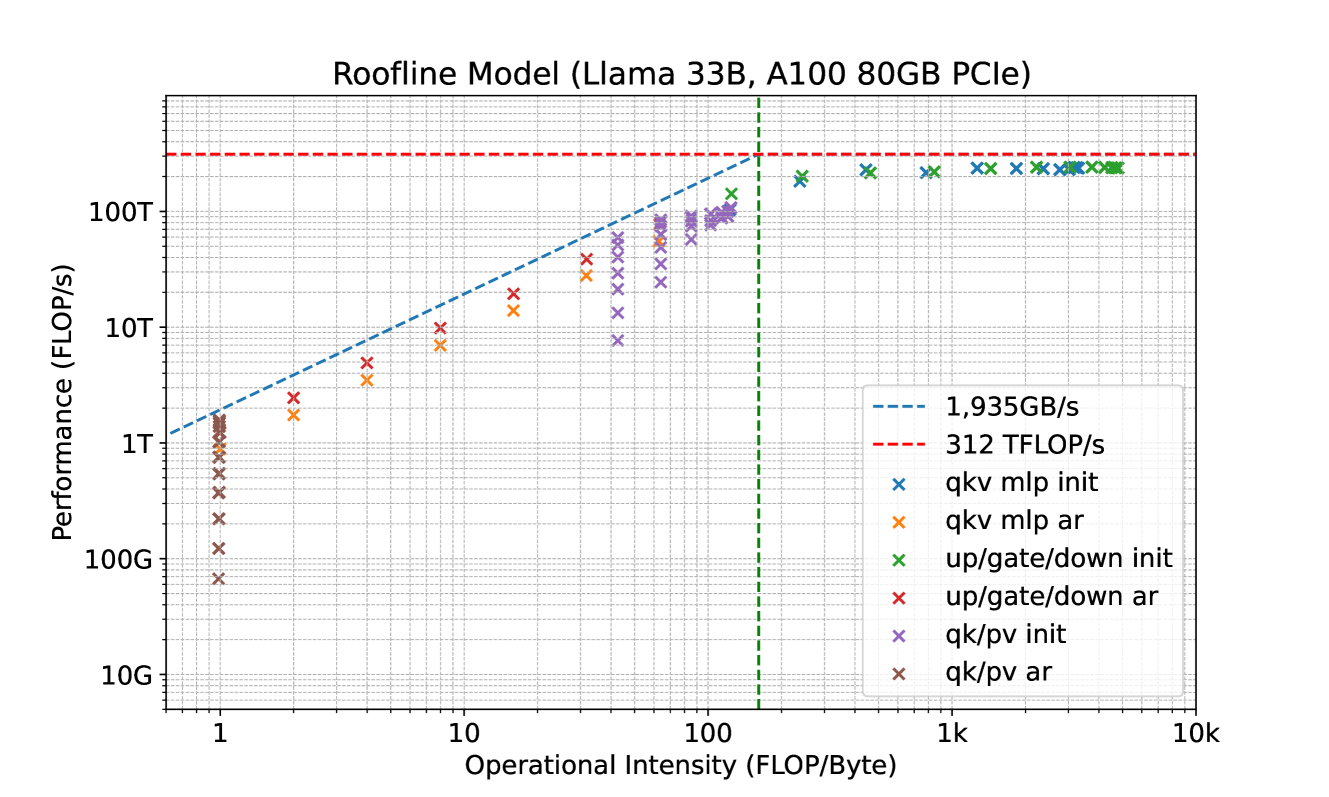
**Roofline Model (Llama 33B, A100 80GB PCIe)**
## Axes
- **X-Axis**: Operational Intensity (FLOP/Byte)
- Range: 1 to 10,000 (logarithmic scale)
- Grid lines: Dashed vertical lines at 1, 10, 100, 1,000
- **Y-Axis**: Performance (FLOP/s)
- Range: 10G to 100T (logarithmic scale)
- Grid lines: Dashed horizontal lines at 10G, 100G, 1T, 10T, 100T
## Key Lines
1. **Blue Dashed Line**:
- Label: `1,935GB/s`
- Represents memory bandwidth limit (Roofline boundary)
2. **Red Dashed Line**:
- Label: `312 TFLOP/s`
- Represents compute limit (Roofline boundary)
3. **Intersection**:
- Point where blue and red lines meet (Roofline)
## Legend
| Color/Symbol | Label | Marker Type |
|--------------|------------------------|-------------|
| Blue | `qkv mlp init` | X |
| Orange | `qkv mlp ar` | X |
| Green | `up/gate/down init` | X |
| Red | `up/gate/down ar` | X |
| Purple | `qk/pv init` | X |
| Brown | `qk/pv ar` | X |
## Data Points
- **Blue Xs**:
- Clustered near the blue dashed line (memory-bound operations)
- **Orange Xs**:
- Distributed along the blue dashed line (memory-bound operations)
- **Green Xs**:
- Clustered near the red dashed line (compute-bound operations)
- **Red Xs**:
- Distributed along the red dashed line (compute-bound operations)
- **Purple Xs**:
- Distributed along the blue dashed line (memory-bound operations)
- **Brown Xs**:
- Clustered at lower operational intensity (memory-bound operations)
## Key Trends
1. **Roofline Boundary**:
- The intersection of the blue (`1,935GB/s`) and red (`312 TFLOP/s`) lines defines the theoretical maximum performance limit.
2. **Operational Intensity vs. Performance**:
- Data points below the Roofline indicate suboptimal utilization of memory bandwidth or compute resources.
- Points near the Roofline (e.g., green and red Xs) represent compute-bound operations.
- Points near the blue dashed line (e.g., blue, orange, purple Xs) represent memory-bound operations.
3. **Performance Scaling**:
- Performance increases logarithmically with operational intensity until hitting the Roofline.
## Additional Notes
- **Grid Lines**:
- Dashed lines at powers of 10 for both axes to aid logarithmic interpretation.
- **Legend Consistency**:
- Colors and markers in the legend match the data points and lines accurately.
- **Model Context**:
- Focuses on Llama 33B model performance on A100 80GB PCIe GPUs.