# Technical Document Extraction: Attention Key Query Score Graph
## Image Description
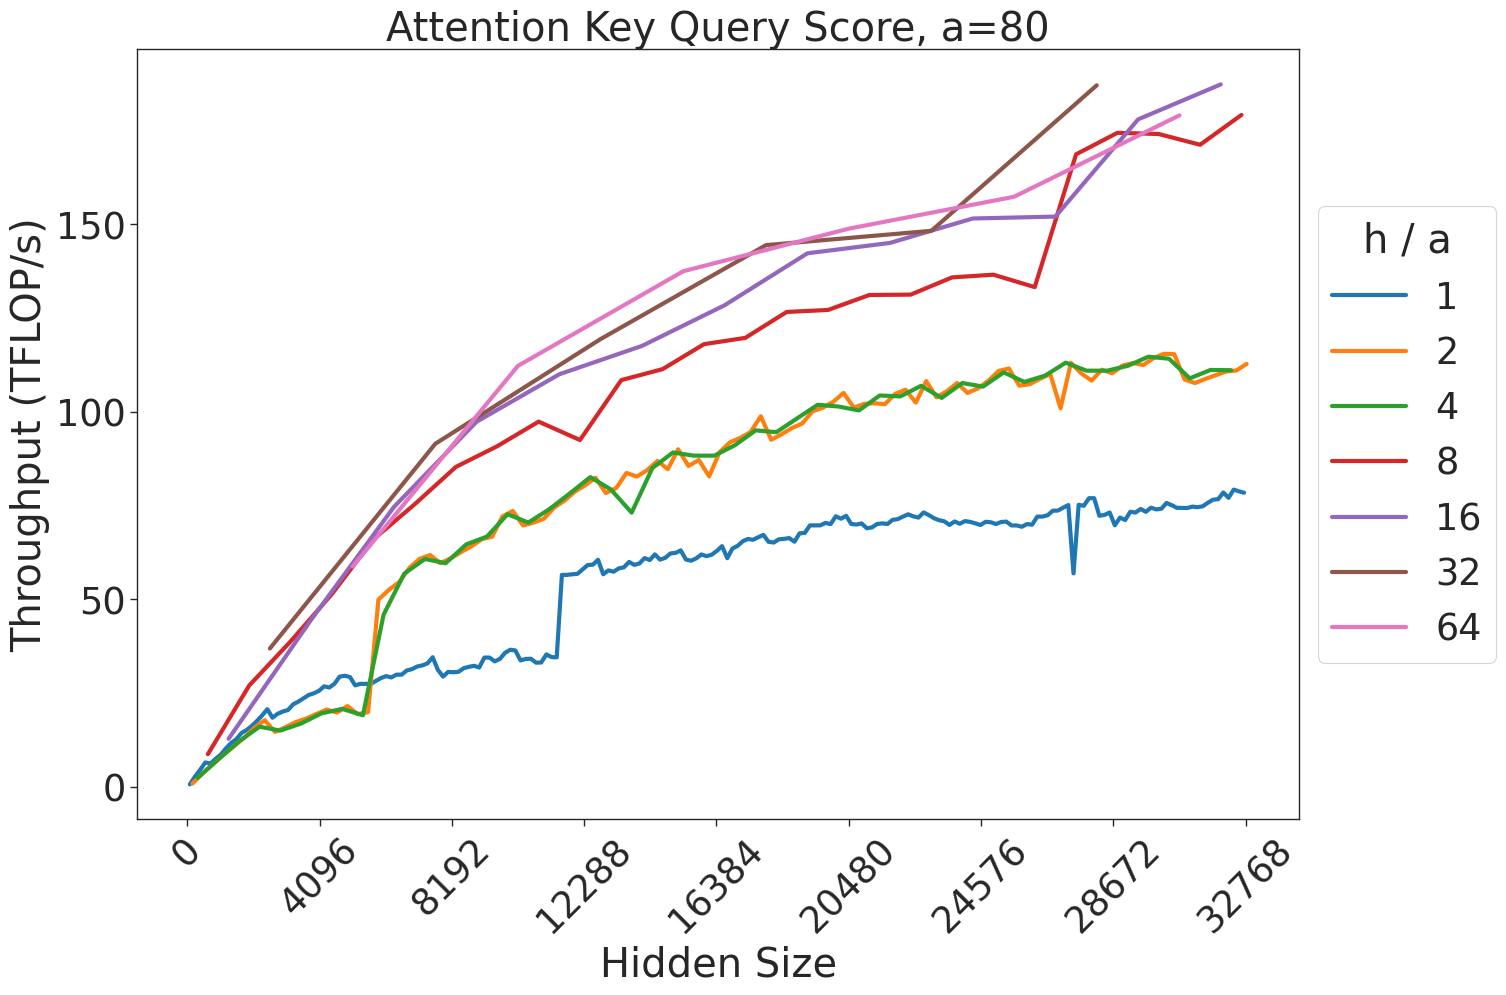
The image is a line graph titled **"Attention Key Query Score, a=80"**. It visualizes the relationship between **Hidden Size** (x-axis) and **Throughput (TFLOPs/s)** (y-axis). The graph includes seven data series, each represented by a distinct colored line, corresponding to different **h/a** (hidden size to attention head ratio) values. The legend is positioned on the right side of the graph.
---
## Key Components
### Axes
- **X-axis (Hidden Size)**:
- Range: 0 to 32,768
- Tick marks at: 0, 4,096, 8,192, 12,288, 16,384, 20,480, 24,576, 28,672, 32,768
- Label: "Hidden Size"
- **Y-axis (Throughput)**:
- Range: 0 to 150 TFLOPs/s
- Tick marks at: 0, 50, 100, 150
- Label: "Throughput (TFLOPs/s)"
### Legend
- Located on the **right side** of the graph.
- Colors and labels:
- **Blue**: h/a = 1
- **Orange**: h/a = 2
- **Green**: h/a = 4
- **Red**: h/a = 8
- **Purple**: h/a = 16
- **Brown**: h/a = 32
- **Pink**: h/a = 64
---
## Data Series Analysis
### 1. h/a = 1 (Blue Line)
- **Trend**: Starts at 0 TFLOPs/s, rises gradually, and plateaus around **70–80 TFLOPs/s** at Hidden Size = 32,768.
- **Key Points**:
- At Hidden Size = 0: 0 TFLOPs/s
- At Hidden Size = 32,768: ~75 TFLOPs/s
### 2. h/a = 2 (Orange Line)
- **Trend**: Similar to h/a = 1 but slightly higher. Plateaus near **80–90 TFLOPs/s**.
- **Key Points**:
- At Hidden Size = 32,768: ~85 TFLOPs/s
### 3. h/a = 4 (Green Line)
- **Trend**: Steeper ascent than h/a = 2. Plateaus near **100–110 TFLOPs/s**.
- **Key Points**:
- At Hidden Size = 32,768: ~105 TFLOPs/s
### 4. h/a = 8 (Red Line)
- **Trend**: Sharp increase, surpassing h/a = 4. Plateaus near **120–130 TFLOPs/s**.
- **Key Points**:
- At Hidden Size = 32,768: ~125 TFLOPs/s
### 5. h/a = 16 (Purple Line)
- **Trend**: Outperforms h/a = 8. Plateaus near **140–150 TFLOPs/s**.
- **Key Points**:
- At Hidden Size = 32,768: ~145 TFLOPs/s
### 6. h/a = 32 (Brown Line)
- **Trend**: Highest-performing series. Exceeds h/a = 16, plateauing near **160 TFLOPs/s**.
- **Key Points**:
- At Hidden Size = 32,768: ~160 TFLOPs/s
### 7. h/a = 64 (Pink Line)
- **Trend**: Steepest ascent, achieving the highest throughput. Plateaus near **170 TFLOPs/s**.
- **Key Points**:
- At Hidden Size = 32,768: ~170 TFLOPs/s
---
## Cross-Referenced Observations
- **Color Consistency**: All lines match the legend (e.g., pink = h/a = 64, blue = h/a = 1).
- **Spatial Grounding**: The legend is positioned on the right, aligned with the y-axis.
- **Trend Verification**: Higher h/a ratios correlate with higher throughput, especially at larger Hidden Sizes.
---
## Limitations
- The graph does not provide **exact numerical values** for intermediate data points. Approximations are based on visual scaling.
- No textual annotations or additional context (e.g., experimental conditions) are present in the image.
---
## Conclusion
The graph demonstrates a clear trend: **increasing h/a ratios result in higher throughput**, particularly at larger Hidden Sizes. The h/a = 64 (pink) series achieves the highest throughput (~170 TFLOPs/s), while h/a = 1 (blue) is the lowest (~75 TFLOPs/s). This suggests that optimizing h/a ratios can significantly improve computational efficiency in attention-based models.