## Line Chart: Throughput Comparison of A100 and V100 GPUs
### Overview
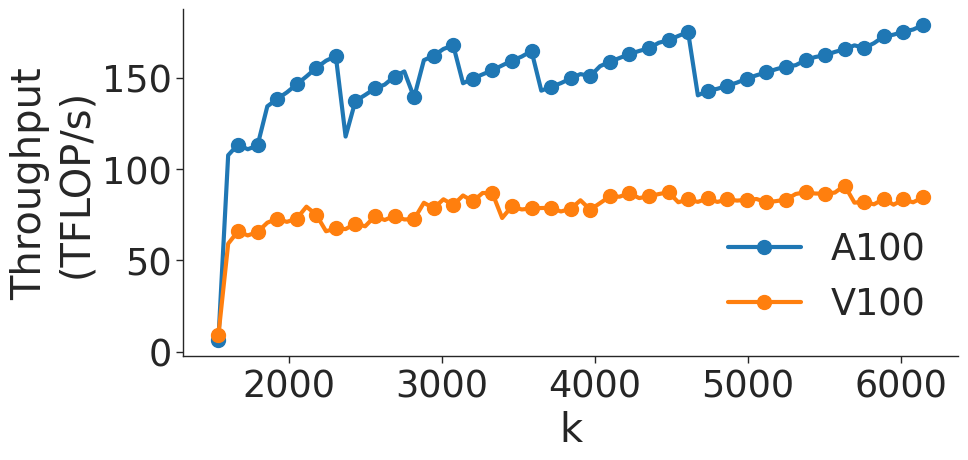
The image displays a line chart comparing the computational throughput (measured in TFLOP/s) of two GPU architectures, the A100 and the V100, across a variable range labeled 'k'. The chart illustrates that the A100 consistently achieves higher throughput than the V100, though it exhibits a distinct, periodic "sawtooth" performance pattern, whereas the V100 maintains a more stable, albeit lower, performance profile.
### Components/Axes
* **Y-Axis:** Labeled "Throughput (TFLOP/s)". The scale ranges from 0 to 150+, with major tick marks at 0, 50, 100, and 150.
* **X-Axis:** Labeled "k". The scale ranges from approximately 1500 to 6000, with major tick marks at 2000, 3000, 4000, 5000, and 6000.
* **Legend:** Located in the bottom-right quadrant of the chart area.
* **Blue line with circular markers:** Labeled "A100".
* **Orange line with circular markers:** Labeled "V100".
### Detailed Analysis
#### A100 Series (Blue Line)
* **Visual Trend:** The line begins at a low value (~5 TFLOP/s) at the start of the x-axis (~1500k), then spikes sharply to ~115 TFLOP/s. Following this, the line exhibits a "sawtooth" pattern: it trends upward, reaches a local peak, drops sharply, and repeats.
* **Data Points/Behavior:**
* **Initial Jump:** Rises from ~5 to ~115 TFLOP/s.
* **Periodic Drops:** Sharp performance regressions occur at approximately k=2300, k=3300, and k=4700.
* **Peak Performance:** The series trends upward between drops, reaching a maximum of approximately 180 TFLOP/s at the far right of the chart (k ≈ 6000).
#### V100 Series (Orange Line)
* **Visual Trend:** The line begins at a low value (~10 TFLOP/s) at the start of the x-axis (~1500k), then jumps to ~65 TFLOP/s. After this initial jump, the line remains relatively flat and stable, with minor fluctuations, showing no significant upward or downward trend.
* **Data Points/Behavior:**
* **Initial Jump:** Rises from ~10 to ~65 TFLOP/s.
* **Stability:** The throughput oscillates slightly between ~65 TFLOP/s and ~90 TFLOP/s throughout the remainder of the x-axis range.
### Key Observations
* **Performance Gap:** The A100 significantly outperforms the V100 across the entire measured range. Once the initial jump occurs, the A100's lowest performance points (after the drops) are generally comparable to or higher than the V100's peak performance.
* **Pattern Divergence:** The A100 exhibits high sensitivity to the 'k' parameter, characterized by the periodic sawtooth drops. This suggests a cyclical bottleneck, such as memory allocation, cache flushing, or kernel re-compilation/re-launching that occurs at specific intervals of 'k'.
* **Stability:** The V100 is remarkably stable, suggesting it is less affected by the specific variable 'k' or that it hits a different, more consistent hardware bottleneck (likely compute-bound) that prevents the performance scaling seen in the A100.
### Interpretation
The data suggests a performance benchmark of a computational workload (likely matrix multiplication or a similar tensor operation) where 'k' represents a dimension size (e.g., sequence length, batch size, or hidden dimension).
* **A100 Behavior:** The sawtooth pattern is a classic indicator of "tiling" or "blocking" strategies in GPU programming. As 'k' increases, the GPU utilizes its resources more efficiently until a threshold is reached where the workload no longer fits perfectly into the cache or register file, forcing a less efficient execution path (the sharp drop), after which it begins to scale efficiently again.
* **V100 Behavior:** The V100's flat performance suggests it is operating in a regime where it is consistently compute-bound or memory-bandwidth-bound, regardless of the specific 'k' value, or that its architecture handles these specific 'k' increments with less overhead variation than the A100.
* **Conclusion:** The A100 is the superior architecture for this workload, providing roughly 2x the throughput of the V100, despite the periodic performance regressions.