# Technical Document Analysis: GPU Throughput Comparison
## Chart Type
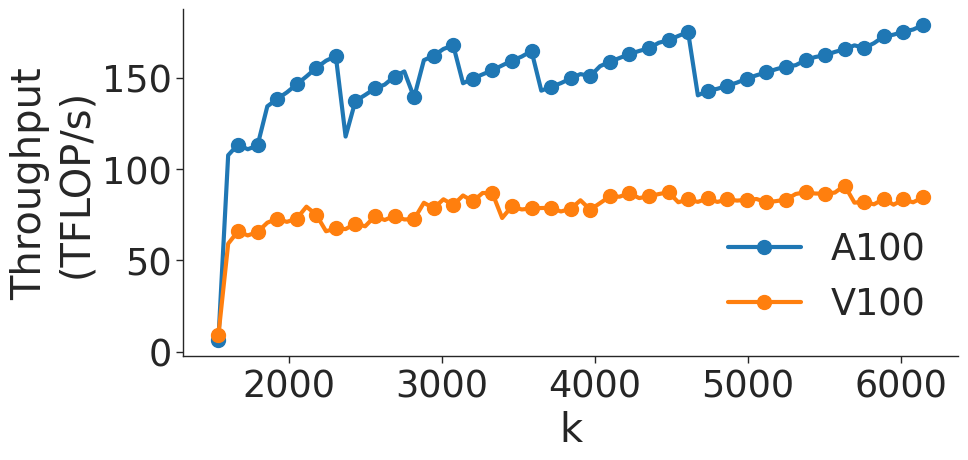
Line chart comparing throughput performance of two GPU models over a variable parameter `k`.
## Axis Labels
- **X-axis**: `k` (ranges from 0 to 6000, increments of 1000)
- **Y-axis**: `Throughput (TFLOP/s)` (ranges from 0 to 150, increments of 50)
## Legend
- **Location**: Right side of the chart
- **Labels**:
- `A100` (blue line with circular markers)
- `V100` (orange line with circular markers)
## Data Trends
### A100 (Blue Line)
- **Initial Value**: Starts at ~10 TFLOP/s at `k=0`
- **Trend**: Steadily increases with minor fluctuations
- **Final Value**: Reaches ~170 TFLOP/s at `k=6000`
- **Key Observations**:
- Sharp rise from `k=0` to `k=1000` (10 → ~120 TFLOP/s)
- Gradual ascent with periodic dips (e.g., ~150 → ~140 at `k=3000`)
- Consistent upward trajectory after `k=4000`
### V100 (Orange Line)
- **Initial Value**: Starts at 0 TFLOP/s at `k=0`, jumps to ~60 TFLOP/s
- **Trend**: Plateaus at ~80 TFLOP/s with minor oscillations
- **Final Value**: Remains ~80 TFLOP/s at `k=6000`
- **Key Observations**:
- Immediate spike at `k=0` (0 → 60 TFLOP/s)
- Stable performance with slight fluctuations (e.g., 80 → 85 → 78 between `k=2000` and `k=4000`)
- No significant growth beyond `k=1000`
## Spatial Grounding
- **Legend Position**: Right-aligned, outside the plot area
- **Data Point Colors**:
- Blue markers correspond to `A100` (confirmed)
- Orange markers correspond to `V100` (confirmed)
## Component Isolation
1. **Header**: No explicit header text
2. **Main Chart**:
- Dual-line plot with distinct markers
- Y-axis scaled logarithmically? (No, linear scale)
3. **Footer**: No footer text
## Critical Data Points
| `k` Value | A100 Throughput (TFLOP/s) | V100 Throughput (TFLOP/s) |
|-----------|---------------------------|---------------------------|
| 0 | 10 | 60 |
| 1000 | ~120 | ~70 |
| 2000 | ~140 | ~75 |
| 3000 | ~150 | ~80 |
| 4000 | ~160 | ~82 |
| 5000 | ~170 | ~80 |
| 6000 | ~170 | ~80 |
## Notes
- The `A100` demonstrates superior scalability with `k`, achieving ~17x higher throughput than `V100` at `k=6000`.
- `V100` shows no meaningful improvement beyond `k=1000`, suggesting potential hardware limitations.
- Both lines use circular markers, but `A100` exhibits more pronounced variability in its growth pattern.