## Box Plot: Steps vs. Food Patch by Model Variant
### Overview
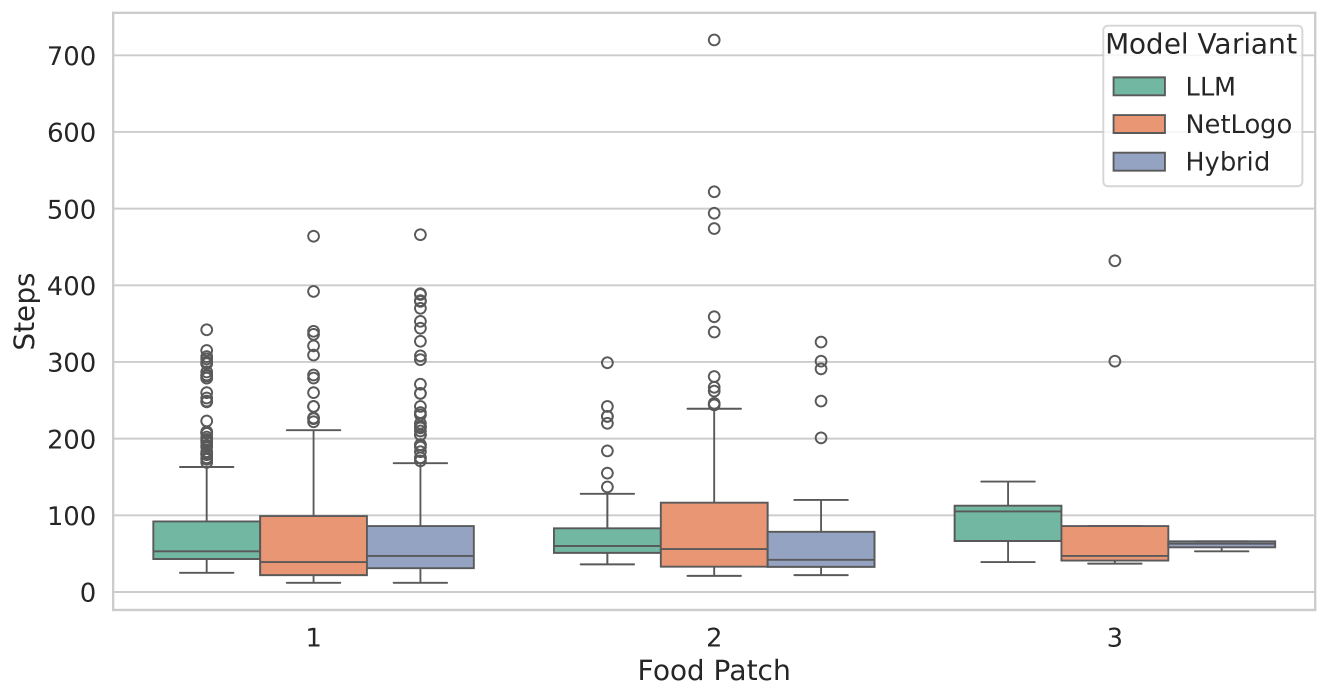
The image is a box plot comparing the number of steps taken by three different model variants (LLM, NetLogo, and Hybrid) across three different food patch scenarios (1, 2, and 3). The y-axis represents the number of steps, and the x-axis represents the food patch number. The plot shows the distribution of steps for each model variant at each food patch, including median, quartiles, and outliers.
### Components/Axes
* **Title:** There is no explicit title on the chart.
* **X-axis:** "Food Patch" with categories 1, 2, and 3.
* **Y-axis:** "Steps" with a numerical scale from 0 to 700, incrementing by 100.
* **Legend:** Located in the top-right corner, labeled "Model Variant".
* LLM (light green)
* NetLogo (light orange)
* Hybrid (light blue/grey)
### Detailed Analysis
The box plot displays the distribution of "Steps" for each "Model Variant" across different "Food Patch" values.
**Food Patch 1:**
* **LLM (light green):** The box extends from approximately 30 to 90 steps. The median is around 60 steps. There are numerous outliers ranging from approximately 150 to 470 steps.
* **NetLogo (light orange):** The box extends from approximately 20 to 100 steps. The median is around 50 steps. There are numerous outliers ranging from approximately 150 to 400 steps.
* **Hybrid (light blue/grey):** The box extends from approximately 20 to 80 steps. The median is around 50 steps. There are numerous outliers ranging from approximately 160 to 400 steps.
**Food Patch 2:**
* **LLM (light green):** The box extends from approximately 30 to 80 steps. The median is around 50 steps. There are numerous outliers ranging from approximately 120 to 720 steps.
* **NetLogo (light orange):** The box extends from approximately 20 to 120 steps. The median is around 60 steps. There are numerous outliers ranging from approximately 150 to 520 steps.
* **Hybrid (light blue/grey):** The box extends from approximately 20 to 80 steps. The median is around 50 steps. There are numerous outliers ranging from approximately 120 to 370 steps.
**Food Patch 3:**
* **LLM (light green):** The box extends from approximately 40 to 110 steps. The median is around 80 steps. There is one outlier at approximately 300 steps and another at approximately 430 steps.
* **NetLogo (light orange):** The box extends from approximately 30 to 80 steps. The median is around 50 steps. There are no visible outliers.
* **Hybrid (light blue/grey):** The box extends from approximately 40 to 70 steps. The median is around 60 steps. There are no visible outliers.
### Key Observations
* The number of steps generally decreases from Food Patch 1 to Food Patch 3 for all model variants.
* Food Patch 2 has the most outliers, particularly for the LLM and NetLogo variants.
* The Hybrid model variant consistently has a lower median and fewer outliers compared to LLM and NetLogo, especially in Food Patch 1 and 2.
* The LLM variant has the highest outlier values in Food Patch 2.
### Interpretation
The box plot suggests that the "Hybrid" model variant is more efficient (takes fewer steps) compared to the "LLM" and "NetLogo" variants, especially in scenarios represented by Food Patch 1 and 2. The high number of outliers in Food Patch 1 and 2 for LLM and NetLogo indicates that these models are more prone to taking a significantly larger number of steps in certain instances. The decrease in steps from Food Patch 1 to Food Patch 3 could indicate that the environment or task becomes easier or more streamlined as the food patch number increases. The outliers may represent instances where the models got "stuck" or took a less direct path to the goal.