\n
## Box Plot: Steps vs. Food Patch for Different Model Variants
### Overview
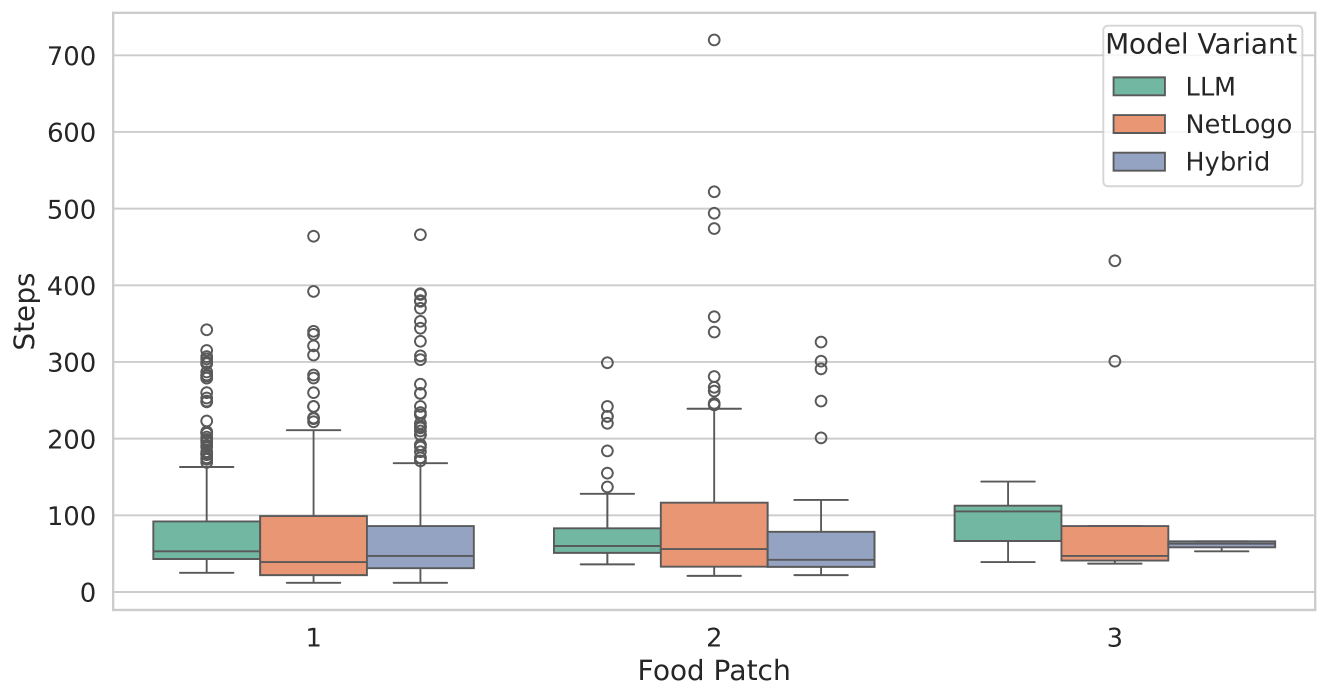
The image presents a series of box plots comparing the number of "Steps" taken by three different "Model Variants" (LLM, NetLogo, and Hybrid) across three "Food Patch" conditions (1, 2, and 3). The box plots visualize the distribution of steps for each model variant within each food patch, showing median, quartiles, and outliers.
### Components/Axes
* **X-axis:** "Food Patch" with categories 1, 2, and 3.
* **Y-axis:** "Steps" ranging from 0 to 700, with increments of 100.
* **Legend (top-right):**
* LLM (Green)
* NetLogo (Red)
* Hybrid (Blue)
### Detailed Analysis
The data is presented as box plots for each combination of Food Patch and Model Variant.
**Food Patch 1:**
* **LLM (Green):** The median is approximately 80 steps. The box extends from roughly 50 to 120 steps. There are several outliers ranging from approximately 150 to 350 steps.
* **NetLogo (Red):** The median is approximately 180 steps. The box extends from roughly 120 to 280 steps. There are numerous outliers ranging from approximately 280 to 450 steps.
* **Hybrid (Blue):** The median is approximately 120 steps. The box extends from roughly 80 to 200 steps. There are several outliers ranging from approximately 200 to 350 steps.
**Food Patch 2:**
* **LLM (Green):** The median is approximately 70 steps. The box extends from roughly 40 to 110 steps. There are several outliers ranging from approximately 120 to 300 steps.
* **NetLogo (Red):** The median is approximately 150 steps. The box extends from roughly 100 to 250 steps. There are numerous outliers ranging from approximately 250 to 550 steps.
* **Hybrid (Blue):** The median is approximately 100 steps. The box extends from roughly 60 to 180 steps. There are several outliers ranging from approximately 180 to 350 steps.
**Food Patch 3:**
* **LLM (Green):** The median is approximately 80 steps. The box extends from roughly 50 to 120 steps. There are several outliers ranging from approximately 120 to 300 steps.
* **NetLogo (Red):** The median is approximately 100 steps. The box extends from roughly 60 to 160 steps. There are several outliers ranging from approximately 160 to 400 steps.
* **Hybrid (Blue):** The median is approximately 80 steps. The box extends from roughly 50 to 140 steps. There are several outliers ranging from approximately 140 to 300 steps.
### Key Observations
* NetLogo consistently requires more steps than LLM and Hybrid across all food patch conditions.
* The Hybrid model generally requires fewer steps than NetLogo but more than LLM in Food Patch 1 and 2. In Food Patch 3, Hybrid and LLM have similar median step counts.
* All model variants exhibit outliers, indicating variability in the number of steps required.
* Food Patch 2 appears to have the highest variability in steps for NetLogo, as evidenced by the wider box and numerous outliers.
### Interpretation
The data suggests that the choice of model variant significantly impacts the number of steps required to complete a task, as defined by the "Food Patch" condition. NetLogo consistently requires the most steps, potentially indicating a less efficient algorithm or a more complex exploration strategy. The LLM model appears to be the most efficient, consistently requiring the fewest steps. The Hybrid model represents a middle ground, potentially combining the strengths of both LLM and NetLogo.
The presence of outliers suggests that the task is not deterministic, and the number of steps required can vary significantly even under the same conditions. The variability in Food Patch 2 for NetLogo could indicate that this condition presents a particularly challenging or unpredictable environment.
The box plots provide a clear visual comparison of the distributions of steps for each model variant and food patch, allowing for a nuanced understanding of their relative performance. The data could be used to inform the selection of the most appropriate model variant for a given task or to identify areas for improvement in the algorithms.