## Box Plot: Steps by Food Patch and Model Variant
### Overview
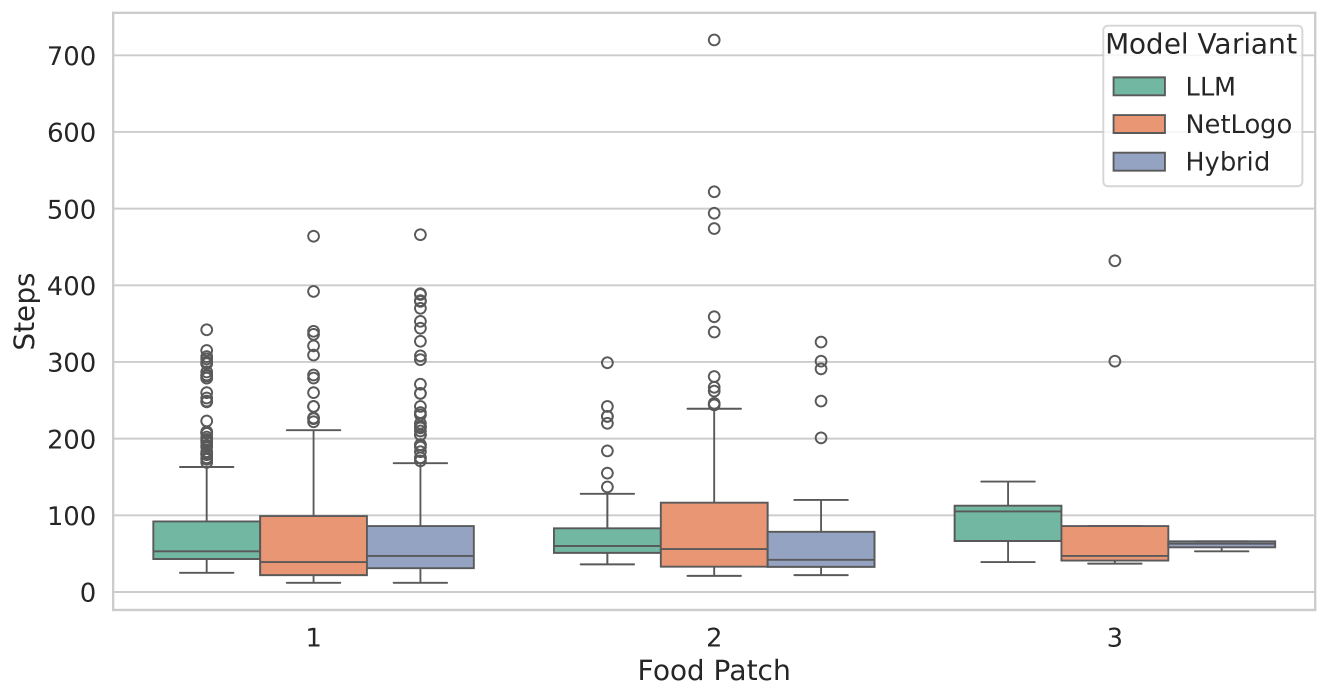
The image is a grouped box plot comparing the distribution of "Steps" (y-axis) across three different "Food Patch" categories (x-axis) for three distinct model variants. The chart visualizes performance variability, central tendency, and outliers for each model within each patch scenario.
### Components/Axes
* **Chart Type:** Grouped Box Plot.
* **Y-Axis:**
* **Label:** "Steps"
* **Scale:** Linear, ranging from 0 to 700.
* **Major Ticks:** 0, 100, 200, 300, 400, 500, 600, 700.
* **X-Axis:**
* **Label:** "Food Patch"
* **Categories:** 1, 2, 3.
* **Legend:**
* **Title:** "Model Variant"
* **Location:** Top-right corner of the plot area.
* **Items:**
* **LLM:** Teal/green color.
* **NetLogo:** Orange/salmon color.
* **Hybrid:** Blue-gray/periwinkle color.
* **Data Representation:** For each Food Patch (1, 2, 3), three box plots are displayed side-by-side, corresponding to the three model variants in the order listed in the legend (LLM, NetLogo, Hybrid).
### Detailed Analysis
**Food Patch 1:**
* **LLM (Teal):**
* **Trend:** Moderate spread with a low median.
* **Values (Approximate):** Median ≈ 50. Interquartile Range (IQR) ≈ 40 to 90. Whiskers extend from ≈25 to ≈160. Numerous outliers are present, clustered between ≈180 and ≈340.
* **NetLogo (Orange):**
* **Trend:** Similar median to LLM but a wider IQR and more high-value outliers.
* **Values (Approximate):** Median ≈ 45. IQR ≈ 25 to 100. Whiskers extend from ≈10 to ≈210. Outliers are densely packed from ≈220 up to ≈460.
* **Hybrid (Blue-Gray):**
* **Trend:** Median and IQR similar to LLM, with a comparable outlier range.
* **Values (Approximate):** Median ≈ 45. IQR ≈ 35 to 85. Whiskers extend from ≈10 to ≈170. Outliers range from ≈180 to ≈460.
**Food Patch 2:**
* **LLM (Teal):**
* **Trend:** Slightly higher median than in Patch 1, with a tighter IQR.
* **Values (Approximate):** Median ≈ 60. IQR ≈ 50 to 80. Whiskers extend from ≈30 to ≈130. Outliers are present from ≈140 to ≈300.
* **NetLogo (Orange):**
* **Trend:** Highest median and widest IQR of all groups. Exhibits the most extreme outliers.
* **Values (Approximate):** Median ≈ 60. IQR ≈ 35 to 115. Whiskers extend from ≈20 to ≈240. Outliers are very spread out, with points at ≈260, ≈280, ≈340, ≈360, ≈480, ≈490, ≈500, ≈520, and one extreme outlier at ≈720.
* **Hybrid (Blue-Gray):**
* **Trend:** Lower median and tighter IQR compared to NetLogo in this patch.
* **Values (Approximate):** Median ≈ 40. IQR ≈ 30 to 80. Whiskers extend from ≈20 to ≈120. Outliers range from ≈200 to ≈320.
**Food Patch 3:**
* **LLM (Teal):**
* **Trend:** Highest median for the LLM model across patches, with a moderate IQR.
* **Values (Approximate):** Median ≈ 100. IQR ≈ 70 to 110. Whiskers extend from ≈40 to ≈145. No visible outliers.
* **NetLogo (Orange):**
* **Trend:** Median lower than LLM in this patch, with a wider spread.
* **Values (Approximate):** Median ≈ 45. IQR ≈ 35 to 85. Whiskers extend from ≈30 to ≈90. Two distinct outliers at ≈300 and ≈430.
* **Hybrid (Blue-Gray):**
* **Trend:** Extremely tight distribution, indicating highly consistent performance.
* **Values (Approximate):** Median ≈ 60. IQR is very narrow, ≈55 to 65. Whiskers are short, extending from ≈50 to ≈70. No visible outliers.
### Key Observations
1. **NetLogo Variability:** The NetLogo model shows the highest variability (widest IQRs) and the most extreme outliers, particularly in Food Patch 2, where one run required over 700 steps.
2. **Hybrid Consistency in Patch 3:** The Hybrid model demonstrates remarkably consistent performance in Food Patch 3, with a very narrow box and short whiskers.
3. **LLM Stability:** The LLM model's median steps increase from Patch 1 to Patch 3, but its IQR remains relatively stable, suggesting a shift in central tendency without a major change in spread.
4. **Outlier Clustering:** Outliers for all models in Patches 1 and 2 are predominantly on the high end (above the upper whisker), indicating that while most runs complete within a certain step count, a significant subset of runs takes considerably longer.
5. **Patch 3 Anomaly:** Food Patch 3 shows a different pattern. The LLM has the highest median, while the Hybrid model is the most consistent. The NetLogo model has a low median but still exhibits high-value outliers.
### Interpretation
This chart compares the efficiency (measured in steps) of three agent-based modeling approaches (LLM, NetLogo, Hybrid) across three different environmental configurations (Food Patches 1, 2, 3).
* **Performance & Reliability:** The Hybrid model appears most reliable in the specific scenario of Food Patch 3, showing predictable performance. The NetLogo model is the least predictable, with a high risk of very long runs (high step counts), especially in Patch 2.
* **Environmental Impact:** The "Food Patch" variable significantly influences model performance. Patch 2 appears to be the most challenging or variable environment, causing the widest performance spreads and most extreme outliers. Patch 3 seems to create conditions where the LLM model requires more steps on average, but the Hybrid model excels in consistency.
* **Underlying Dynamics:** The presence of numerous high-step outliers across Patches 1 and 2 for all models suggests that the task or environment has conditions that can occasionally lead to inefficient or prolonged agent behavior, regardless of the model architecture. The investigation would benefit from analyzing what specific conditions in Patch 2 cause the extreme NetLogo outlier (700+ steps).
* **Model Selection Insight:** The choice of optimal model is context-dependent. For consistent, predictable results in a scenario like Patch 3, the Hybrid model is superior. If avoiding extremely long runs is critical, NetLogo may be a riskier choice due to its high outlier potential. The LLM offers a middle-ground, stable performance profile.