## Box Plot: Model Variant Performance Across Food Patches
### Overview
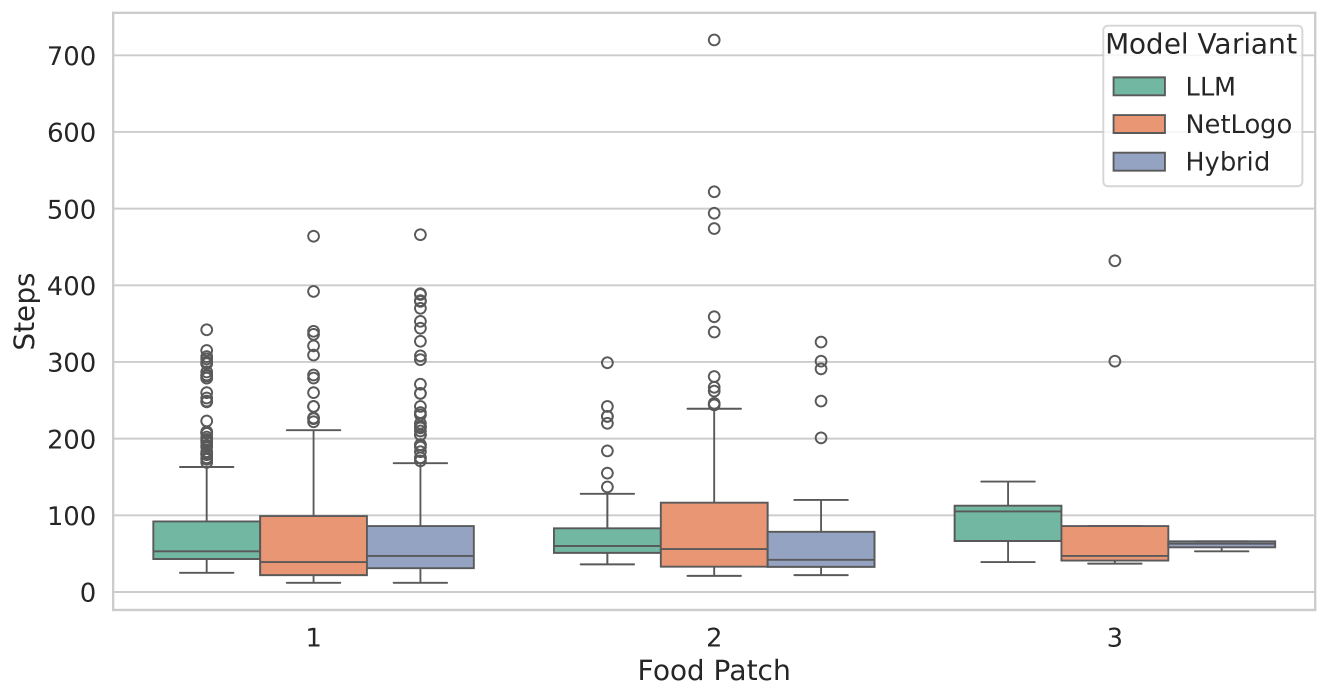
The image displays a comparative box plot analysis of three computational model variants (LLM, NetLogo, Hybrid) across three food patch scenarios (1, 2, 3). The y-axis measures "Steps" (numerical effort metric), while the x-axis categorizes data by food patch number. The plot includes statistical summaries (median, quartiles) and outlier points for each model-patch combination.
### Components/Axes
- **X-axis (Food Patch)**: Categorical scale with three discrete values (1, 2, 3)
- **Y-axis (Steps)**: Continuous scale from 0 to 700, with gridlines at 100-unit intervals
- **Legend**: Located in top-right corner, mapping colors to model variants:
- Green: LLM
- Orange: NetLogo
- Blue: Hybrid
- **Box Plot Elements**:
- Median line (bold horizontal line within boxes)
- Interquartile range (box boundaries)
- Whiskers (extending to 1.5×IQR)
- Outlier points (circles beyond whiskers)
### Detailed Analysis
#### Food Patch 1
- **LLM (Green)**: Median ≈ 80 steps, IQR 60–100, outliers at 200–400 steps
- **NetLogo (Orange)**: Median ≈ 90 steps, IQR 70–110, outliers at 300–450 steps
- **Hybrid (Blue)**: Median ≈ 70 steps, IQR 50–90, outliers at 200–350 steps
#### Food Patch 2
- **LLM (Green)**: Median ≈ 70 steps, IQR 50–90, outliers at 250–500 steps
- **NetLogo (Orange)**: Median ≈ 100 steps, IQR 80–120, outliers at 300–520 steps
- **Hybrid (Blue)**: Median ≈ 60 steps, IQR 40–80, outliers at 200–300 steps
#### Food Patch 3
- **LLM (Green)**: Median ≈ 100 steps, IQR 80–120, outliers at 300–420 steps
- **NetLogo (Orange)**: Median ≈ 70 steps, IQR 50–90, outliers at 200–350 steps
- **Hybrid (Blue)**: Median ≈ 50 steps, IQR 30–70, outliers at 150–300 steps
### Key Observations
1. **Model Consistency**:
- NetLogo shows the highest median steps across all patches (1: 90, 2: 100, 3: 70)
- Hybrid consistently demonstrates the lowest median steps (1: 70, 2: 60, 3: 50)
- LLM exhibits variable performance, with a notable increase in patch 3
2. **Outlier Patterns**:
- Patch 2 contains the most extreme outliers (up to 520 steps for NetLogo)
- Patch 1 has the widest interquartile ranges for all models
3. **Trend Verification**:
- LLM's median steps increase by 25% from patch 1 to 3 (80 → 100)
- NetLogo's median steps decrease by 22% from patch 2 to 3 (100 → 70)
- Hybrid shows a 14% decrease from patch 1 to 2 (70 → 60), then 17% from 2 to 3 (60 → 50)
### Interpretation
The data suggests model performance varies significantly by food patch configuration:
- **NetLogo** appears most efficient in patch 2 but underperforms in patch 3, potentially indicating context-dependent optimization
- **LLM** demonstrates scalability in patch 3 but shows high variability (large IQR and outliers)
- **Hybrid** maintains consistent low performance across all patches, suggesting limited adaptability
The outlier patterns (particularly in patch 2) warrant investigation into edge-case scenarios that cause disproportionate step counts. The increasing median for LLM in patch 3 might indicate improved algorithmic efficiency with more complex patch configurations, while NetLogo's decline suggests potential overfitting to simpler environments.