## Chart: Hits@1 vs. latency on WebQSP
### Overview
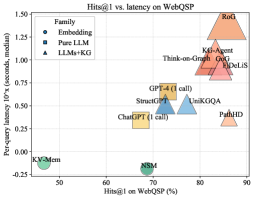
This is a scatter plot comparing the Hits@1 metric on the WebQSP dataset against the per-query latency. The plot shows different models categorized into three families: Embedding, Pure LLM, and LLMs+KG. Each point represents a model, with its position indicating its performance on the two metrics.
### Components/Axes
* **Title:** Hits@1 vs. latency on WebQSP
* **X-axis:** Hits@1 on WebQSP (%)
* Scale: 50 to 90, with tick marks at intervals of 10.
* **Y-axis:** Per-query latency 10'x (seconds, median)
* Scale: -0.25 to 1.50, with tick marks at intervals of 0.25.
* **Legend:** Located in the top-left corner.
* Embedding: Represented by blue circles.
* Pure LLM: Represented by yellow squares.
* LLMs+KG: Represented by orange triangles.
### Detailed Analysis
* **Embedding Models:**
* KV-Mem: Located at approximately (48, -0.15).
* NSM: Located at approximately (68, -0.15).
* **Pure LLM Models:**
* ChatGPT (1 call): Located at approximately (65, 0.30).
* StructGT: Located at approximately (73, 0.50).
* GPT-4 (1 call): Located at approximately (75, 0.55).
* **LLMs+KG Models:**
* PathHD: Located at approximately (82, 0.35).
* UniKGQA: Located at approximately (80, 0.50).
* DeLiS: Located at approximately (82, 0.85).
* GOG: Located at approximately (81, 0.95).
* Think-on-Graph: Located at approximately (79, 1.00).
* K-Agent: Located at approximately (78, 1.05).
* RoG: Located at approximately (87, 1.45).
### Key Observations
* The LLMs+KG models generally have higher latency and higher Hits@1 scores compared to the Embedding and Pure LLM models.
* Embedding models have the lowest latency but also the lowest Hits@1 scores.
* Pure LLM models fall in between, with moderate latency and Hits@1 scores.
* There is a positive correlation between latency and Hits@1 score, suggesting that models with higher accuracy tend to have higher latency.
* RoG has the highest latency and Hits@1 score.
* KV-Mem and NSM have the lowest latency and Hits@1 score.
### Interpretation
The scatter plot visualizes the trade-off between accuracy (Hits@1) and latency for different models on the WebQSP dataset. The data suggests that incorporating knowledge graphs (LLMs+KG) generally improves accuracy but at the cost of increased latency. Embedding models offer a low-latency solution but with lower accuracy. Pure LLM models provide a balance between the two. The choice of model depends on the specific requirements of the application, where either accuracy or latency may be prioritized. The outlier RoG shows that very high accuracy can be achieved, but with a significant increase in latency.