## Scatter Plot: Hits@1 vs. Latency on WebQSP
### Overview
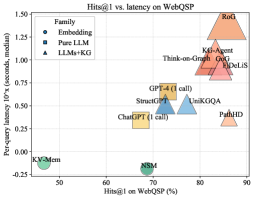
The image is a scatter plot comparing **Hits@1 performance** (x-axis, percentage) and **per-query latency** (y-axis, seconds) for various AI systems on the WebQSP benchmark. Three categories are distinguished: **Embedding**, **Pure LLM**, and **LLMs+KG**, each with unique symbols and colors.
---
### Components/Axes
- **X-axis**: Hits@1 on WebQSP (%)
- Range: 50% to 90%
- Labels: Discrete ticks at 50, 60, 70, 80, 90.
- **Y-axis**: Per-query latency (10^x seconds)
- Range: -0.25 to 1.50 (logarithmic scale)
- Labels: Discrete ticks at -0.25, 0.00, 0.25, 0.50, 0.75, 1.00, 1.25, 1.50.
- **Legend**:
- **Embedding**: Circles (green, blue)
- **Pure LLM**: Squares (yellow, blue, orange)
- **LLMs+KG**: Triangles (orange, red, blue)
- Positioned in the top-left corner.
---
### Detailed Analysis
#### Data Points by Category
1. **Embedding**
- **KV-Mem**: (50%, -0.25s)
- **NSM**: (70%, 0.00s)
2. **Pure LLM**
- **ChatGPT (1 call)**: (65%, 0.50s)
- **StructGPT**: (70%, 0.40s)
- **GPT-4 (1 call)**: (75%, 0.75s)
3. **LLMs+KG**
- **UniKGQA**: (75%, 0.50s)
- **Think-on-Graph**: (80%, 0.80s)
- **KG-Agent**: (85%, 1.00s)
- **PathHD**: (85%, 0.30s)
- **RoG**: (90%, 1.50s)
#### Spatial Grounding
- **Legend**: Top-left corner, clearly labeled with symbols and categories.
- **Data Points**:
- **Embedding**: Bottom-left quadrant (low latency, moderate Hits@1).
- **Pure LLM**: Middle-right quadrant (higher Hits@1, moderate latency).
- **LLMs+KG**: Top-right quadrant (highest Hits@1 and latency).
---
### Key Observations
1. **Trade-off Between Accuracy and Latency**:
- Higher Hits@1 generally correlates with increased latency, especially in **LLMs+KG** (e.g., RoG at 90% Hits@1 and 1.50s latency).
2. **Outliers**:
- **PathHD** (85% Hits@1, 0.30s latency) deviates from the trend, showing high accuracy with low latency.
- **KV-Mem** (-0.25s latency) is an anomaly, possibly indicating negative latency due to measurement error or optimization.
3. **Performance Tiers**:
- **Embedding**: Fastest but least accurate.
- **Pure LLM**: Balanced performance.
- **LLMs+KG**: Most accurate but slowest.
---
### Interpretation
The plot illustrates a **trade-off between accuracy (Hits@1) and computational efficiency (latency)**. Systems combining LLMs with knowledge graphs (**LLMs+KG**) achieve the highest accuracy but incur significant latency, suggesting complex reasoning processes. **PathHD** stands out as an efficient hybrid model, while **KV-Mem** and **NSM** (Embedding) prioritize speed over accuracy. The logarithmic y-axis emphasizes latency differences at higher performance levels, highlighting the computational cost of advanced models like RoG.
This data underscores the need for context-aware system design, where the choice of model depends on application-specific priorities (e.g., real-time vs. precision-critical tasks).