## Violin Plot Comparison: Model Performance Across Metrics
### Overview
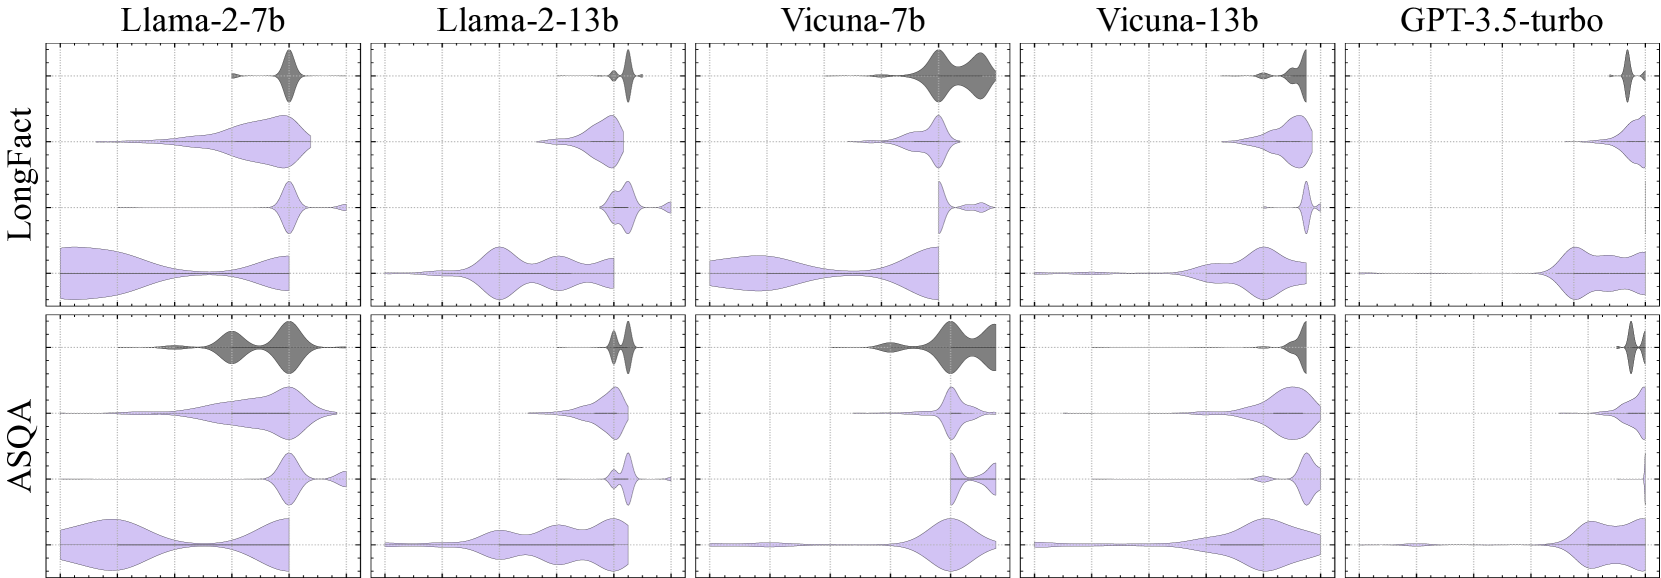
The image presents a grid of violin plots comparing the performance distributions of five AI models (Llama-2-7b, Llama-2-13b, Vicuna-7b, Vicuna-13b, GPT-3.5-turbo) across two metrics: **LongFact** (top row) and **ASQA** (bottom row). Each plot visualizes the distribution of values for a specific model-metric combination, with color-coded distributions (purple for LongFact, gray for ASQA) and grid-aligned axes.
---
### Components/Axes
- **X-axis**: Labeled "Value" (no numerical scale provided, but distributions suggest values range approximately between 0 and 1).
- **Y-axis**:
- Top row: "LongFact" (purple distributions).
- Bottom row: "ASQA" (gray distributions).
- **Legend**: Located in the top-right corner, mapping:
- Purple: LongFact
- Gray: ASQA
- **Grid**: Light gray horizontal and vertical lines for reference.
- **Background**: White.
---
### Detailed Analysis
#### LongFact (Top Row)
1. **Llama-2-7b**:
- Wide distribution with a peak near 0.5.
- Long tails extending to ~0.1 and ~0.9.
2. **Llama-2-13b**:
- Narrower distribution, peaking sharply at ~0.4.
- Minimal spread compared to Llama-2-7b.
3. **Vicuna-7b**:
- Broad distribution with a peak at ~0.6.
- Extended tails to ~0.2 and ~0.8.
4. **Vicuna-13b**:
- Similar to Vicuna-7b but slightly narrower.
- Peak at ~0.55.
5. **GPT-3.5-turbo**:
- Very narrow distribution, concentrated near 0.4.
- Minimal variability.
#### ASQA (Bottom Row)
1. **Llama-2-7b**:
- Bimodal distribution with peaks at ~0.3 and ~0.7.
- Significant spread between modes.
2. **Llama-2-13b**:
- Single peak at ~0.4.
- Narrower than Llama-2-7b.
3. **Vicuna-7b**:
- Sharp peak at ~0.5.
- Minimal spread.
4. **Vicuna-13b**:
- Similar to Vicuna-7b but slightly broader.
- Peak at ~0.52.
5. **GPT-3.5-turbo**:
- Narrow distribution centered at ~0.2.
- Extremely low variability.
---
### Key Observations
1. **LongFact Performance**:
- Vicuna-7b and Vicuna-13b exhibit the highest central tendency (~0.55–0.6).
- GPT-3.5-turbo shows the lowest and most consistent performance (~0.4).
- Llama-2 models display bimodal or wide distributions, suggesting variability in outcomes.
2. **ASQA Performance**:
- Vicuna-7b and Vicuna-13b achieve the highest central tendency (~0.5–0.52).
- GPT-3.5-turbo underperforms significantly (~0.2).
- Llama-2-7b’s bimodal distribution indicates inconsistent results.
3. **Model Size Trends**:
- Larger models (e.g., Llama-2-13b, Vicuna-13b) generally show narrower distributions in LongFact, implying greater consistency.
- In ASQA, larger models (Vicuna-13b) maintain high performance but with slightly more spread than smaller Vicuna models.
4. **Color Consistency**:
- Purple (LongFact) and gray (ASQA) distributions align precisely with the legend. No mismatches observed.
---
### Interpretation
The data suggests that **Vicuna models outperform others in LongFact**, particularly the 7b variant, which achieves the highest peak (~0.6). However, their performance in ASQA is more variable, with Llama-2-7b showing bimodal results. GPT-3.5-turbo consistently underperforms in both metrics, with the lowest central tendency (~0.2–0.4). The narrow distributions of Llama-2-13b and GPT-3.5-turbo indicate lower variability, while wider distributions (e.g., Vicuna-7b in LongFact) suggest greater diversity in outcomes. This could reflect differences in training data, architecture, or task-specific optimization. The ASQA metric appears more sensitive to model size, with larger models (Vicuna-13b) maintaining higher performance than smaller ones (Llama-2-7b).
Notably, the absence of numerical scales limits precise quantification, but the relative trends are clear. The grid alignment and legend placement ensure clarity in distinguishing metrics and models.