## Chart: Number of MC steps vs. Dimension for different q2* values
### Overview
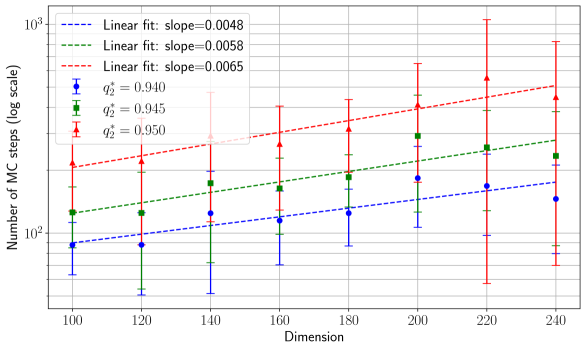
The image is a scatter plot showing the relationship between the number of Monte Carlo (MC) steps (on a log scale) and the dimension, for three different values of a parameter denoted as q2*. Error bars are displayed for each data point. Linear fits are also plotted for each q2* value, with their slopes indicated in the legend.
### Components/Axes
* **X-axis:** Dimension, with tick marks at 100, 120, 140, 160, 180, 200, 220, and 240.
* **Y-axis:** Number of MC steps (log scale), ranging from approximately 50 to 1000, with tick marks at 10^2 (100) and 10^3 (1000).
* **Legend (Top-Left):**
* Blue dashed line: Linear fit: slope=0.0048
* Green dashed line: Linear fit: slope=0.0058
* Red dashed line: Linear fit: slope=0.0065
* Blue circle: q2* = 0.940
* Green square: q2* = 0.945
* Red triangle: q2* = 0.950
### Detailed Analysis
* **q2* = 0.940 (Blue circles):**
* Trend: The number of MC steps increases with dimension.
* Data points (approximate):
* Dimension 100: ~70 MC steps
* Dimension 120: ~90 MC steps
* Dimension 140: ~110 MC steps
* Dimension 160: ~120 MC steps
* Dimension 180: ~130 MC steps
* Dimension 200: ~140 MC steps
* Dimension 220: ~150 MC steps
* Dimension 240: ~160 MC steps
* **q2* = 0.945 (Green squares):**
* Trend: The number of MC steps increases with dimension.
* Data points (approximate):
* Dimension 100: ~110 MC steps
* Dimension 120: ~130 MC steps
* Dimension 140: ~150 MC steps
* Dimension 160: ~170 MC steps
* Dimension 180: ~180 MC steps
* Dimension 200: ~200 MC steps
* Dimension 220: ~220 MC steps
* Dimension 240: ~240 MC steps
* **q2* = 0.950 (Red triangles):**
* Trend: The number of MC steps increases with dimension.
* Data points (approximate):
* Dimension 100: ~140 MC steps
* Dimension 120: ~160 MC steps
* Dimension 140: ~190 MC steps
* Dimension 160: ~220 MC steps
* Dimension 180: ~240 MC steps
* Dimension 200: ~270 MC steps
* Dimension 220: ~300 MC steps
* Dimension 240: ~330 MC steps
### Key Observations
* The number of MC steps generally increases with dimension for all values of q2*.
* Higher values of q2* correspond to a higher number of MC steps for a given dimension.
* The error bars appear to increase in size with increasing dimension.
* The linear fits have positive slopes, indicating a positive correlation between dimension and the number of MC steps.
* The slope of the linear fit increases with increasing q2*.
### Interpretation
The plot suggests that as the dimension increases, the number of Monte Carlo steps required for the simulation to converge also increases. Furthermore, the parameter q2* seems to influence the number of MC steps needed, with higher values of q2* leading to a greater number of steps. The increasing error bars with dimension might indicate that the uncertainty in the number of MC steps also grows as the dimension increases, potentially due to the increased complexity of the system being simulated. The linear fits provide a simplified model of the relationship between dimension and MC steps, and the slopes quantify the rate at which the number of MC steps increases with dimension for each q2* value.