\n
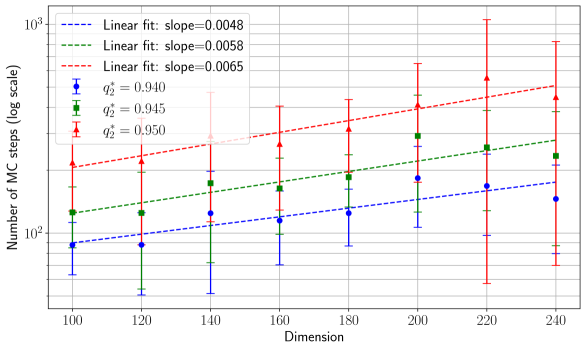
## Chart: Monte Carlo Steps vs. Dimension
### Overview
The image presents a chart illustrating the relationship between the number of Monte Carlo (MC) steps required and the dimension of a problem. The y-axis represents the number of MC steps on a logarithmic scale, while the x-axis represents the dimension. Three different curves are plotted, each representing a different value of R-squared (R²), with error bars indicating the uncertainty in the number of MC steps. Linear fits are shown for each curve, with their respective slopes provided.
### Components/Axes
* **X-axis:** Dimension, ranging from approximately 100 to 240.
* **Y-axis:** Number of MC steps (log scale), ranging from approximately 10^1 to 10^3.
* **Curves:** Three curves, each representing a different R² value:
* Blue dashed line: R² = 0.940, slope = 0.0048
* Green solid line: R² = 0.945, slope = 0.0058
* Red dashed-dotted line: R² = 0.950, slope = 0.0065
* **Error Bars:** Vertical error bars are present for each data point, indicating the uncertainty in the number of MC steps.
* **Legend:** Located in the top-left corner, detailing the R² values, slopes, and line styles.
### Detailed Analysis
The chart shows a clear positive correlation between dimension and the number of MC steps required. As the dimension increases, the number of MC steps needed also increases for all three R² values.
**Blue Curve (R² = 0.940):**
The blue dashed line shows a relatively slow increase in the number of MC steps with increasing dimension.
* At Dimension = 100, Number of MC steps ≈ 150
* At Dimension = 120, Number of MC steps ≈ 180
* At Dimension = 140, Number of MC steps ≈ 210
* At Dimension = 160, Number of MC steps ≈ 240
* At Dimension = 180, Number of MC steps ≈ 270
* At Dimension = 200, Number of MC steps ≈ 300
* At Dimension = 220, Number of MC steps ≈ 330
* At Dimension = 240, Number of MC steps ≈ 360
**Green Curve (R² = 0.945):**
The green solid line shows a steeper increase in the number of MC steps compared to the blue curve.
* At Dimension = 100, Number of MC steps ≈ 220
* At Dimension = 120, Number of MC steps ≈ 260
* At Dimension = 140, Number of MC steps ≈ 300
* At Dimension = 160, Number of MC steps ≈ 340
* At Dimension = 180, Number of MC steps ≈ 380
* At Dimension = 200, Number of MC steps ≈ 420
* At Dimension = 220, Number of MC steps ≈ 460
* At Dimension = 240, Number of MC steps ≈ 500
**Red Curve (R² = 0.950):**
The red dashed-dotted line exhibits the steepest increase in the number of MC steps.
* At Dimension = 100, Number of MC steps ≈ 300
* At Dimension = 120, Number of MC steps ≈ 360
* At Dimension = 140, Number of MC steps ≈ 420
* At Dimension = 160, Number of MC steps ≈ 480
* At Dimension = 180, Number of MC steps ≈ 540
* At Dimension = 200, Number of MC steps ≈ 600
* At Dimension = 220, Number of MC steps ≈ 660
* At Dimension = 240, Number of MC steps ≈ 720
The error bars are relatively consistent across all dimensions for each curve, indicating a similar level of uncertainty in the number of MC steps.
### Key Observations
* The number of MC steps required increases linearly with dimension for all three R² values.
* Higher R² values correspond to steeper slopes, indicating that a greater number of MC steps are needed for a given increase in dimension.
* The slopes of the linear fits are relatively small (0.0048, 0.0058, 0.0065), suggesting that the increase in MC steps with dimension is gradual.
* The R² values are all very high (0.940, 0.945, 0.950), indicating a strong linear relationship between dimension and the number of MC steps.
### Interpretation
The data suggests that the computational cost of Monte Carlo simulations increases with the dimensionality of the problem. The higher the R² value, the more sensitive the simulation is to the dimension. This is likely due to the "curse of dimensionality," where the volume of the search space grows exponentially with dimension, requiring more samples (MC steps) to achieve the same level of accuracy. The linear fits provide a simple model for estimating the number of MC steps needed for a given dimension, but it's important to note that this model may not hold true for very high dimensions or complex problems. The consistent error bars suggest that the uncertainty in the number of MC steps is relatively constant across different dimensions, which could be due to the inherent randomness of the Monte Carlo method. The differences in slopes between the curves with different R² values suggest that the relationship between dimension and MC steps may be influenced by other factors, such as the specific algorithm used or the properties of the problem being solved.