## Line Graph: Model Loss Over Training Epochs
### Overview
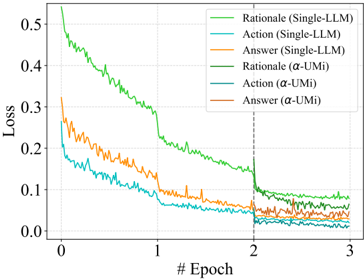
The image is a line graph comparing the training loss of different models across 3 epochs. Five lines represent distinct model configurations, with loss values decreasing over time. The graph includes a legend, axis labels, and a vertical dashed line at epoch 2.
### Components/Axes
- **X-axis**: Labeled "# Epoch" with ticks at 0, 1, 2, 3.
- **Y-axis**: Labeled "Loss" with values ranging from 0.0 to 0.5 in increments of 0.1.
- **Legend**: Located in the top-right corner, listing six model configurations:
1. **Rational (Single-LLM)** – Green line
2. **Action (Single-LLM)** – Blue line
3. **Answer (Single-LLM)** – Orange line
4. **Rational (α-UMi)** – Dark green line
5. **Action (α-UMi)** – Dark blue line
6. **Answer (α-UMi)** – Dark orange line
- **Dashed Line**: Vertical line at epoch 2 (x=2).
### Detailed Analysis
1. **Rational (Single-LLM)** (Green):
- Starts at ~0.5 loss at epoch 0.
- Decreases sharply to ~0.05 by epoch 3.
- Shows minor fluctuations but a consistent downward trend.
2. **Action (Single-LLM)** (Blue):
- Begins at ~0.3 loss at epoch 0.
- Drops to ~0.02 by epoch 3.
- Slightly more volatile than the Rational line.
3. **Answer (Single-LLM)** (Orange):
- Starts at ~0.35 loss at epoch 0.
- Declines to ~0.03 by epoch 3.
- Exhibits moderate fluctuations.
4. **Rational (α-UMi)** (Dark Green):
- Initial loss ~0.15 at epoch 0.
- Reduces to ~0.01 by epoch 3.
- Smoother decline compared to Single-LLM variants.
5. **Answer (α-UMi)** (Dark Orange):
- Begins at ~0.1 loss at epoch 0.
- Drops to ~0.005 by epoch 3.
- Most stable and lowest final loss among all lines.
**Note**: The legend lists six models, but only five lines are visible in the graph. The "Action (α-UMi)" (dark blue) line is missing, suggesting a potential error in the image or legend.
### Key Observations
- All models show decreasing loss over epochs, indicating improved performance.
- **α-UMi models** (dark green/orange) consistently outperform Single-LLM models (green/blue/orange) in final loss values.
- The **Rational (Single-LLM)** model has the highest initial loss but the steepest decline.
- The **Answer (α-UMi)** model achieves the lowest final loss (~0.005), suggesting superior efficiency.
### Interpretation
The graph demonstrates that models using the **α-UMi framework** (likely a more advanced or optimized architecture) achieve significantly lower training losses compared to Single-LLM baselines. This implies that α-UMi models may be more effective at minimizing error during training. The Rational (Single-LLM) model, despite starting with the highest loss, shows the most aggressive improvement, possibly due to its design prioritizing rapid convergence. The missing "Action (α-UMi)" line introduces ambiguity, but the visible trends suggest α-UMi models generally outperform their Single-LLM counterparts. The vertical dashed line at epoch 2 may indicate a phase shift in training dynamics, though its significance is unclear without additional context.