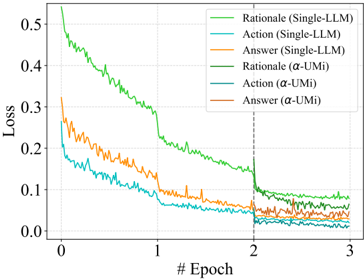
## Chart: Loss vs. Epoch for Different Models
### Overview
The image is a line graph showing the loss (y-axis) versus the number of epochs (x-axis) for different models. The models are "Single-LLM" and "α-UMi", and the loss is plotted for "Rationale", "Action", and "Answer" for each model.
### Components/Axes
* **X-axis:** "# Epoch" ranging from 0 to 3.
* **Y-axis:** "Loss" ranging from 0.0 to 0.5.
* **Legend (top-right):**
* Green: Rationale (Single-LLM)
* Orange: Action (Single-LLM)
* Light Blue: Answer (Single-LLM)
* Dark Green: Rationale (α-UMi)
* Teal: Action (α-UMi)
* Brown: Answer (α-UMi)
* A vertical dashed line is present at Epoch = 2.
### Detailed Analysis
* **Rationale (Single-LLM) - Green:** Starts at approximately 0.52 loss and decreases rapidly until epoch 1, then decreases more slowly to approximately 0.17 at epoch 3.
* **Action (Single-LLM) - Orange:** Starts at approximately 0.24 loss and decreases to approximately 0.04 at epoch 3.
* **Answer (Single-LLM) - Light Blue:** Starts at approximately 0.18 loss and decreases to approximately 0.02 at epoch 3.
* **Rationale (α-UMi) - Dark Green:** Starts at approximately 0.32 loss and decreases rapidly until epoch 1, then decreases more slowly to approximately 0.08 at epoch 3.
* **Action (α-UMi) - Teal:** Starts at approximately 0.12 loss and decreases to approximately 0.01 at epoch 3.
* **Answer (α-UMi) - Brown:** Starts at approximately 0.20 loss and decreases to approximately 0.03 at epoch 3.
### Key Observations
* All loss curves decrease as the number of epochs increases, indicating learning.
* The "Single-LLM" model's "Rationale" loss starts higher and decreases more slowly than the other curves.
* The vertical dashed line at epoch 2 seems to indicate a change in the training process, as there is a slight change in the slope of some of the curves at this point.
* The "Action" and "Answer" losses for both models are generally lower than the "Rationale" losses.
* The α-UMi model generally has lower loss values than the Single-LLM model for the "Rationale" component.
### Interpretation
The graph compares the training loss of two different models (Single-LLM and α-UMi) across three components: Rationale, Action, and Answer. The decreasing loss values indicate that both models are learning effectively during training. The α-UMi model appears to perform better than the Single-LLM model, especially in terms of the "Rationale" component, as it achieves lower loss values. The vertical line at epoch 2 suggests a potential change in the training regime, which may have influenced the learning rate or optimization process. The lower loss values for "Action" and "Answer" compared to "Rationale" might indicate that these components are easier to learn or are better optimized within the models.