## Chart/Diagram Type: Combined Line Charts
### Overview
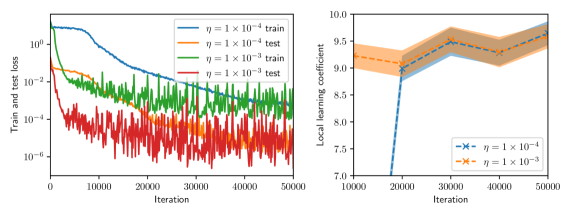
The image presents two line charts side-by-side. The left chart displays "Train and test loss" on a logarithmic scale against "Iteration". It compares the performance of two learning rates (η = 1 x 10^-4 and η = 1 x 10^-3) for both training and testing data. The right chart shows "Local learning coefficient" against "Iteration" for the same two learning rates.
### Components/Axes
**Left Chart:**
* **Y-axis:** "Train and test loss" (logarithmic scale). Axis markers are 10^0, 10^-2, 10^-4, and 10^-6.
* **X-axis:** "Iteration". Axis markers are 0, 10000, 20000, 30000, 40000, and 50000.
* **Legend (top-right):**
* Blue line: "η = 1 x 10^-4 train"
* Orange line: "η = 1 x 10^-4 test"
* Green line: "η = 1 x 10^-3 train"
* Red line: "η = 1 x 10^-3 test"
**Right Chart:**
* **Y-axis:** "Local learning coefficient". Axis markers are 7.0, 7.5, 8.0, 8.5, 9.0, 9.5, and 10.0.
* **X-axis:** "Iteration". Axis markers are 10000, 20000, 30000, 40000, and 50000.
* **Legend (bottom-left):**
* Blue line with 'x' markers: "η = 1 x 10^-4"
* Orange dashed line with 'x' markers: "η = 1 x 10^-3"
* Shaded regions around each line indicate uncertainty.
### Detailed Analysis
**Left Chart (Train and Test Loss):**
* **η = 1 x 10^-4 train (Blue):** Starts at approximately 2, decreases sharply until around iteration 10000, then decreases gradually until iteration 50000, reaching approximately 0.01.
* **η = 1 x 10^-4 test (Orange):** Starts at approximately 0.1, decreases until around iteration 10000, then fluctuates around 10^-4 until iteration 50000.
* **η = 1 x 10^-3 train (Green):** Starts at approximately 0.3, decreases sharply until around iteration 10000, then decreases gradually until iteration 50000, reaching approximately 0.005.
* **η = 1 x 10^-3 test (Red):** Starts at approximately 0.01, fluctuates around 10^-5 until iteration 50000.
**Right Chart (Local Learning Coefficient):**
* **η = 1 x 10^-4 (Blue):** Starts at approximately 7.0 at iteration 10000, increases to approximately 9.0 at iteration 20000, then remains relatively stable around 9.3 until iteration 50000.
* **η = 1 x 10^-3 (Orange):** Starts at approximately 9.3 at iteration 10000, increases slightly to approximately 9.6 at iteration 30000, then decreases slightly to approximately 9.4 at iteration 50000.
### Key Observations
* In the left chart, the training loss (blue and green lines) decreases more consistently than the test loss (orange and red lines).
* The test loss for η = 1 x 10^-3 (red line) fluctuates significantly more than the test loss for η = 1 x 10^-4 (orange line).
* In the right chart, the local learning coefficient for η = 1 x 10^-4 (blue line) increases sharply initially, while the local learning coefficient for η = 1 x 10^-3 (orange line) remains relatively stable.
* The shaded regions in the right chart indicate the uncertainty or variability in the local learning coefficient.
### Interpretation
The charts compare the performance of two different learning rates (η = 1 x 10^-4 and η = 1 x 10^-3) during the training of a model. The left chart shows that both learning rates result in decreasing training loss, but the test loss behaves differently. The higher learning rate (η = 1 x 10^-3) leads to more fluctuation in the test loss, suggesting potential overfitting. The right chart shows the local learning coefficient, which provides insight into how the model is adapting during training. The lower learning rate (η = 1 x 10^-4) initially requires a larger adjustment in the learning coefficient, while the higher learning rate (η = 1 x 10^-3) maintains a relatively stable learning coefficient. The shaded regions indicate the variability in the local learning coefficient, which could be due to factors such as the batch size or the specific data used during training.