## Heatmap: AUROC Scores for Different Categories
### Overview
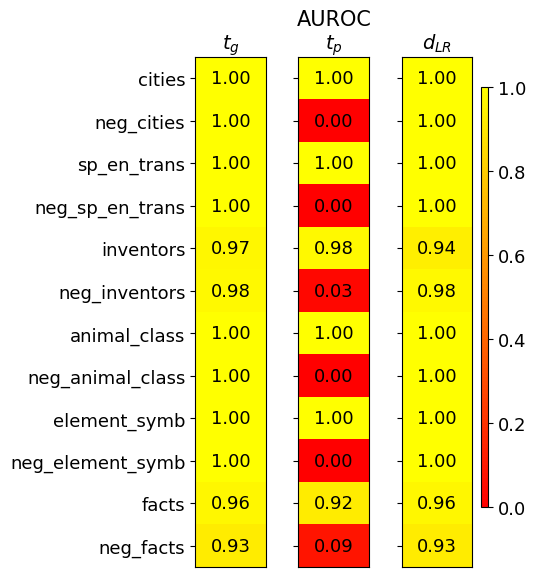
The image is a heatmap displaying AUROC (Area Under the Receiver Operating Characteristic curve) scores for various categories. The heatmap compares three different methods or models, labeled as 'tg', 'tp', and 'dLR', across a set of categories. The color intensity represents the AUROC score, ranging from red (0.0) to yellow (1.0).
### Components/Axes
* **Title:** AUROC
* **Columns (Methods/Models):**
* tg
* tp
* dLR
* **Rows (Categories):**
* cities
* neg\_cities
* sp\_en\_trans
* neg\_sp\_en\_trans
* inventors
* neg\_inventors
* animal\_class
* neg\_animal\_class
* element\_symb
* neg\_element\_symb
* facts
* neg\_facts
* **Color Scale (Legend):** Located on the right side of the heatmap.
* Yellow: 1.0
* Orange: 0.8
* Light Orange: 0.6
* Mid-Orange: 0.4
* Dark Orange: 0.2
* Red: 0.0
### Detailed Analysis or Content Details
Here's a breakdown of the AUROC scores for each category and method:
* **cities:**
* tg: 1.00 (Yellow)
* tp: 1.00 (Yellow)
* dLR: 1.00 (Yellow)
* **neg\_cities:**
* tg: 1.00 (Yellow)
* tp: 0.00 (Red)
* dLR: 1.00 (Yellow)
* **sp\_en\_trans:**
* tg: 1.00 (Yellow)
* tp: 1.00 (Yellow)
* dLR: 1.00 (Yellow)
* **neg\_sp\_en\_trans:**
* tg: 1.00 (Yellow)
* tp: 0.00 (Red)
* dLR: 1.00 (Yellow)
* **inventors:**
* tg: 0.97 (Yellow)
* tp: 0.98 (Yellow)
* dLR: 0.94 (Yellow)
* **neg\_inventors:**
* tg: 0.98 (Yellow)
* tp: 0.03 (Red)
* dLR: 0.98 (Yellow)
* **animal\_class:**
* tg: 1.00 (Yellow)
* tp: 1.00 (Yellow)
* dLR: 1.00 (Yellow)
* **neg\_animal\_class:**
* tg: 1.00 (Yellow)
* tp: 0.00 (Red)
* dLR: 1.00 (Yellow)
* **element\_symb:**
* tg: 1.00 (Yellow)
* tp: 1.00 (Yellow)
* dLR: 1.00 (Yellow)
* **neg\_element\_symb:**
* tg: 1.00 (Yellow)
* tp: 0.00 (Red)
* dLR: 1.00 (Yellow)
* **facts:**
* tg: 0.96 (Yellow)
* tp: 0.92 (Yellow)
* dLR: 0.96 (Yellow)
* **neg\_facts:**
* tg: 0.93 (Yellow)
* tp: 0.09 (Red)
* dLR: 0.93 (Yellow)
### Key Observations
* The 'tg' and 'dLR' methods consistently achieve high AUROC scores (close to 1.0) across all categories.
* The 'tp' method shows perfect performance (1.0) for positive categories (cities, sp\_en\_trans, animal\_class, element\_symb, facts)
* The 'tp' method performs poorly (0.0) for negative categories (neg\_cities, neg\_sp\_en\_trans, neg\_animal\_class, neg\_element\_symb), except for 'neg\_facts' and 'neg\_inventors' which have slightly higher scores of 0.09 and 0.03 respectively.
* The 'inventors' category has slightly lower scores for all methods compared to other categories.
### Interpretation
The heatmap suggests that the 'tg' and 'dLR' methods are robust and reliable across both positive and negative categories. The 'tp' method appears to be highly sensitive to the distinction between positive and negative categories, performing exceptionally well on positive categories but failing completely on negative categories. This could indicate a bias or a specific design characteristic of the 'tp' method that makes it unsuitable for negative categories. The lower scores for the 'inventors' category across all methods might indicate that this category is inherently more difficult to classify accurately.