\n
## Heatmap: AUROC Performance Across Categories and Methods
### Overview
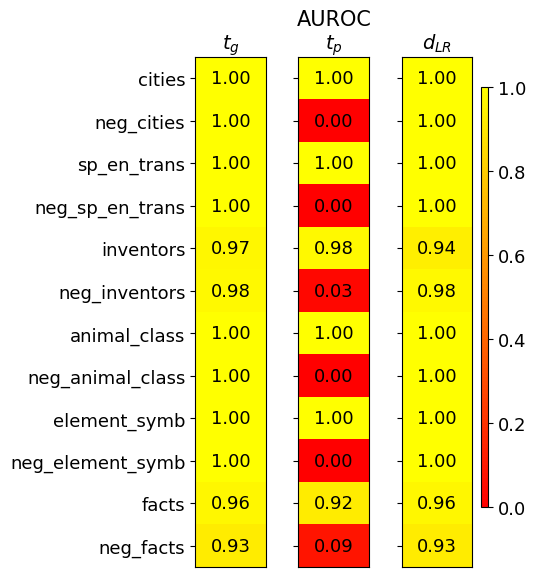
The image is a heatmap visualizing the Area Under the Receiver Operating Characteristic curve (AUROC) performance scores for three different methods or models across twelve distinct categories. The categories include both positive and negated versions of concepts (e.g., "cities" and "neg_cities"). The performance is encoded by color, with a scale from 0.0 (red) to 1.0 (yellow).
### Components/Axes
* **Title:** "AUROC" (centered at the top).
* **Column Headers (Methods):** Three columns are labeled:
* `t_g` (left column)
* `t_p` (middle column)
* `d_{LR}` (right column)
* **Row Labels (Categories):** Twelve categories are listed vertically on the left side:
1. `cities`
2. `neg_cities`
3. `sp_en_trans`
4. `neg_sp_en_trans`
5. `inventors`
6. `neg_inventors`
7. `animal_class`
8. `neg_animal_class`
9. `element_symb`
10. `neg_element_symb`
11. `facts`
12. `neg_facts`
* **Color Scale/Legend:** A vertical color bar is positioned on the far right of the chart.
* **Range:** 0.0 (bottom, red) to 1.0 (top, yellow).
* **Ticks:** Marked at 0.0, 0.2, 0.4, 0.6, 0.8, and 1.0.
* **Gradient:** Transitions from red (low) through orange to yellow (high).
### Detailed Analysis
The following table reconstructs the data from the heatmap. Each cell contains the AUROC value and its approximate color based on the legend.
| Category | `t_g` (Left Column) | `t_p` (Middle Column) | `d_{LR}` (Right Column) |
| :--- | :--- | :--- | :--- |
| **cities** | 1.00 (Yellow) | 1.00 (Yellow) | 1.00 (Yellow) |
| **neg_cities** | 1.00 (Yellow) | 0.00 (Red) | 1.00 (Yellow) |
| **sp_en_trans** | 1.00 (Yellow) | 1.00 (Yellow) | 1.00 (Yellow) |
| **neg_sp_en_trans** | 1.00 (Yellow) | 0.00 (Red) | 1.00 (Yellow) |
| **inventors** | 0.97 (Yellow) | 0.98 (Yellow) | 0.94 (Yellow) |
| **neg_inventors** | 0.98 (Yellow) | 0.03 (Red) | 0.98 (Yellow) |
| **animal_class** | 1.00 (Yellow) | 1.00 (Yellow) | 1.00 (Yellow) |
| **neg_animal_class** | 1.00 (Yellow) | 0.00 (Red) | 1.00 (Yellow) |
| **element_symb** | 1.00 (Yellow) | 1.00 (Yellow) | 1.00 (Yellow) |
| **neg_element_symb** | 1.00 (Yellow) | 0.00 (Red) | 1.00 (Yellow) |
| **facts** | 0.96 (Yellow) | 0.92 (Yellow) | 0.96 (Yellow) |
| **neg_facts** | 0.93 (Yellow) | 0.09 (Red) | 0.93 (Yellow) |
### Key Observations
1. **Perfect Performance:** For the positive (non-negated) categories (`cities`, `sp_en_trans`, `animal_class`, `element_symb`), all three methods (`t_g`, `t_p`, `d_{LR}`) achieve a perfect AUROC score of 1.00.
2. **Catastrophic Failure on Negation for `t_p`:** The most striking pattern is the performance of the `t_p` method on all negated categories (`neg_*`). Its score drops to near zero (0.00 to 0.09), indicated by solid red cells. This represents a complete failure to correctly classify or handle negated concepts.
3. **Robustness of `t_g` and `d_{LR}`:** In stark contrast, both the `t_g` and `d_{LR}` methods maintain very high performance (AUROC ≥ 0.93) across **all** categories, including the negated ones. Their scores are consistently in the yellow range.
4. **Slight Variation in Non-Perfect Scores:** For the categories `inventors` and `facts` (and their negations), the scores for `t_g` and `d_{LR}` are slightly below 1.00 but remain robustly high (0.92-0.98). The `t_p` method also performs well on the positive `inventors` (0.98) and `facts` (0.92) categories before failing on their negations.
### Interpretation
This heatmap provides a clear diagnostic comparison of three methods' ability to handle semantic negation.
* **What the data suggests:** The `t_p` method exhibits a severe and systematic weakness. It performs perfectly on standard concepts but fails completely when the concept is negated (e.g., "not a city"). This indicates its underlying mechanism likely does not properly encode or process logical negation, treating "neg_cities" as a fundamentally different or nonsensical input rather than the inverse of "cities."
* **How elements relate:** The side-by-side comparison highlights that robust performance on positive examples (`t_p` on `cities`) is no guarantee of robustness on their logical counterparts. The `t_g` and `d_{LR}` methods demonstrate a more generalized understanding, as their performance is invariant to the presence of negation.
* **Notable implications:** This is a critical finding for evaluating AI models on reasoning tasks. A model like `t_p` would be unreliable for any application involving logical statements, conditional rules, or datasets where negation is present. The investigation points to a specific failure mode (negation handling) rather than a general lack of capability, as seen by its high scores on positive categories. The near-identical performance of `t_g` and `d_{LR}` suggests they may share a more robust architectural or training approach to semantic representation.