## Heatmap: Model Performance Metrics Across Categories
### Overview
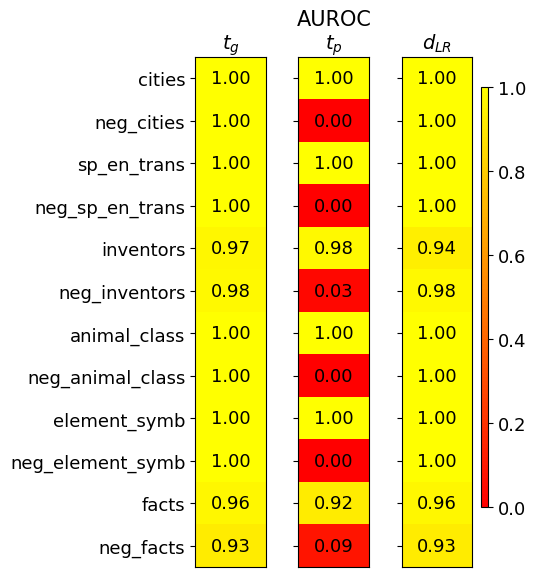
The image displays a heatmap comparing three performance metrics (t_g, t_p, d_LR) across 12 categories. Values range from 0.00 (red) to 1.00 (yellow), with a color gradient legend on the right. The table structure includes row labels (categories) on the left and column headers (metrics) at the top.
### Components/Axes
- **Columns**:
- t_g (leftmost)
- t_p (middle)
- d_LR (rightmost)
- **Rows**:
- cities
- neg_cities
- sp_en_trans
- neg_sp_en_trans
- inventors
- neg_inventors
- animal_class
- neg_animal_class
- element_symb
- neg_element_symb
- facts
- neg_facts
- **Legend**:
- Vertical color bar on the right (red=0.0, yellow=1.0)
- Positioned adjacent to the d_LR column
### Detailed Analysis
| Category | t_g | t_p | d_LR | Color |
|-----------------------|-------|-------|-------|--------|
| cities | 1.00 | 1.00 | 1.00 | Yellow |
| neg_cities | 1.00 | 0.00 | 1.00 | Red |
| sp_en_trans | 1.00 | 1.00 | 1.00 | Yellow |
| neg_sp_en_trans | 1.00 | 0.00 | 1.00 | Red |
| inventors | 0.97 | 0.98 | 0.94 | Yellow |
| neg_inventors | 0.98 | 0.03 | 0.98 | Red |
| animal_class | 1.00 | 1.00 | 1.00 | Yellow |
| neg_animal_class | 1.00 | 0.00 | 1.00 | Red |
| element_symb | 1.00 | 1.00 | 1.00 | Yellow |
| neg_element_symb | 1.00 | 0.00 | 1.00 | Red |
| facts | 0.96 | 0.92 | 0.96 | Yellow |
| neg_facts | 0.93 | 0.09 | 0.93 | Red |
### Key Observations
1. **t_p Column Anomalies**:
- All "neg_" prefixed categories (neg_cities, neg_sp_en_trans, etc.) show **0.00** in t_p, indicating complete failure or absence of performance.
- Non-negative categories maintain high t_p values (0.92–1.00).
2. **Consistency in t_g and d_LR**:
- Both metrics show near-perfect scores (0.93–1.00) across all categories, with only minor deviations in inventors (0.94 d_LR) and facts (0.92 t_p).
3. **Color Gradient Alignment**:
- Red values (0.00–0.09) exclusively appear in t_p for negative categories.
- Yellow values (0.92–1.00) dominate t_g and d_LR, with no red cells in these columns.
### Interpretation
- **Metric Robustness**:
- t_g and d_LR demonstrate consistent high performance across all categories, suggesting they are reliable evaluation metrics.
- t_p exhibits catastrophic failure in negative categories (0.00), raising concerns about its sensitivity to class imbalance or negative sample representation.
- **Model Behavior**:
- The stark contrast between t_p and other metrics in negative categories implies potential issues with negative sample handling in the model architecture.
- High d_LR scores (0.93–1.00) across all categories suggest strong discriminative power, possibly indicating effective feature separation.
- **Practical Implications**:
- Reliance on t_p for evaluation could mask critical performance gaps in negative sample detection.
- The near-unity scores in t_g and d_LR may indicate overfitting or overly optimistic performance estimates requiring validation on independent test sets.
- **Data Quality Considerations**:
- The presence of "neg_" categories suggests a binary classification setup with explicit negative class representation.
- Zero values in t_p for negative categories might reflect data scarcity or class imbalance issues in the training set.