## Chart: Optimization Error vs. Alpha
### Overview
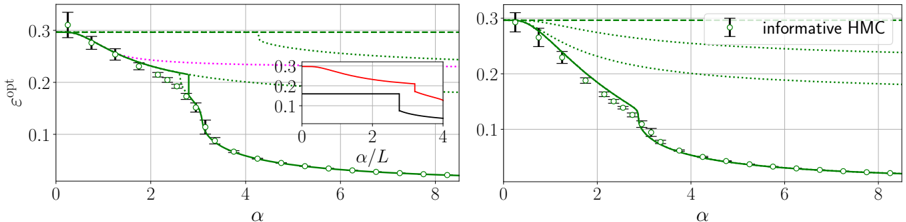
The image presents two identical charts displaying the relationship between optimization error (εopt) and the parameter alpha (α). Both charts also include a comparison to the performance of "informative HMC" (Hamiltonian Monte Carlo). A small inset chart is present in the left plot, showing a different relationship between two variables. The charts use error bars to indicate uncertainty in the data points.
### Components/Axes
* **Y-axis:** εopt (Optimization Error), ranging from approximately 0.05 to 0.35. The scale is linear.
* **X-axis:** α (Alpha), ranging from approximately 0 to 8. The scale is linear.
* **Legend:** Located in the top-right corner of both charts.
* Green dashed line: "informative HMC"
* Dark Green solid line: Represents the primary data series.
* Magenta dashed line: Represents a secondary data series.
* **Error Bars:** Present on each data point, indicating the standard deviation or confidence interval.
* **Inset Chart:** Located in the top-left corner of the left chart.
* X-axis: a/L, ranging from 0 to 4.
* Y-axis: Unlabeled, ranging from approximately 0.1 to 0.3.
* Red solid line: Represents a data series.
* Black solid line: Represents a data series.
### Detailed Analysis or Content Details
**Chart 1 (Left)**
* **Informative HMC (Green Dashed Line):** This line is approximately horizontal, maintaining a value of around 0.31 throughout the range of α.
* **Primary Data Series (Dark Green Solid Line):** This line exhibits a strong downward trend.
* At α ≈ 0, εopt ≈ 0.31.
* At α ≈ 2, εopt ≈ 0.23, with an error bar extending to approximately 0.26.
* At α ≈ 4, εopt ≈ 0.12, with an error bar extending to approximately 0.15.
* At α ≈ 6, εopt ≈ 0.08, with an error bar extending to approximately 0.10.
* At α ≈ 8, εopt ≈ 0.06, with an error bar extending to approximately 0.08.
* **Secondary Data Series (Magenta Dashed Line):** This line initially overlaps with the "informative HMC" line at α ≈ 0. It then decreases slightly before leveling off.
* At α ≈ 0, εopt ≈ 0.31.
* At α ≈ 2, εopt ≈ 0.25, with an error bar extending to approximately 0.28.
* At α ≈ 4, εopt ≈ 0.20, with an error bar extending to approximately 0.23.
* At α ≈ 6, εopt ≈ 0.17, with an error bar extending to approximately 0.20.
* At α ≈ 8, εopt ≈ 0.15, with an error bar extending to approximately 0.18.
* **Inset Chart:** The red line starts at approximately 0.25 at a/L ≈ 0, decreases to approximately 0.15 at a/L ≈ 2, remains constant until a/L ≈ 3.5, and then increases sharply to approximately 0.3 at a/L ≈ 4. The black line is constant at approximately 0.2 until a/L ≈ 2, then drops to approximately 0.1 and remains constant.
**Chart 2 (Right)**
This chart is identical to Chart 1 in terms of data series, trends, and values.
### Key Observations
* The primary data series (dark green) consistently outperforms "informative HMC" as α increases.
* The secondary data series (magenta) performs worse than "informative HMC" across the entire range of α.
* The inset chart shows a step-like function, potentially representing a threshold or switching behavior.
* The error bars indicate that the uncertainty in the data points is relatively consistent across the range of α.
### Interpretation
The charts demonstrate that increasing the parameter α leads to a reduction in optimization error for the primary data series. This suggests that α plays a crucial role in improving the optimization process. The "informative HMC" method provides a baseline performance level, which is surpassed by the primary data series as α increases. The secondary data series, however, does not achieve the same level of performance as "informative HMC".
The inset chart likely represents a different aspect of the optimization process, possibly related to a parameter 'a' normalized by 'L'. The step-like behavior suggests a sudden change in the relationship between these variables at specific values of a/L. The red line could represent a variable that is initially increasing, then plateaus, and finally increases again, while the black line represents a variable that is constant, then drops and remains constant.
The consistent error bars suggest that the observed trends are statistically significant and not simply due to random fluctuations. Overall, the data suggests that careful tuning of the parameter α can significantly improve optimization performance, potentially outperforming established methods like "informative HMC".