\n
## [Chart Type]: Dual-Panel Line Chart with Inset
### Overview
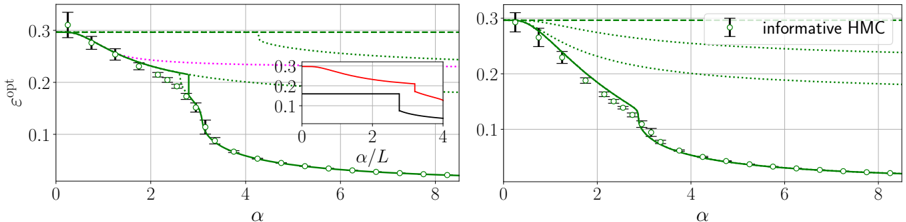
The image displays two side-by-side line charts (left and right panels) plotting the same primary data series. Both charts share identical axes and scales. The left panel includes additional reference lines and an inset graph, while the right panel is simpler, featuring a legend. The charts appear to analyze the relationship between a parameter `α` and an optimal error or efficiency metric `ε^opt`.
### Components/Axes
* **Main Chart (Both Panels):**
* **X-axis:** Labeled `α`. Scale ranges from 0 to 8, with major ticks at 0, 2, 4, 6, 8.
* **Y-axis:** Labeled `ε^opt`. Scale ranges from 0 to 0.3, with major ticks at 0.1, 0.2, 0.3.
* **Inset Graph (Left Panel Only):**
* **Location:** Upper-middle region of the left panel, overlapping the main chart area.
* **X-axis:** Labeled `α/L`. Scale ranges from 0 to 4, with major ticks at 0, 2, 4.
* **Y-axis:** Unlabeled, but shares the same scale as the main chart (0 to 0.3).
* **Legend (Right Panel Only):**
* **Location:** Top-right corner.
* **Content:** A green dashed line with a vertical error bar symbol, labeled `informative HMC`.
* **Data Series & Lines:**
* **Primary Series (Both Panels):** A solid green line with circular markers and vertical error bars. The line starts at approximately (α=0, ε^opt=0.3) and decreases monotonically, flattening as α increases.
* **Reference Lines (Left Panel Only):**
* A horizontal, green dashed line at `ε^opt = 0.3`.
* A horizontal, magenta dotted line at approximately `ε^opt = 0.24`.
* A green dotted line that starts near the primary series at α=0 and diverges slightly above it as α increases.
* **Inset Lines (Left Panel Only):**
* A solid red line.
* A solid black line.
* Both lines show a stepwise decreasing trend.
### Detailed Analysis
**Primary Data Series Trend (Green Solid Line with Circles):**
The trend is a clear, smooth decay. Starting at a maximum value of `ε^opt ≈ 0.3` when `α = 0`, the value drops rapidly as `α` increases from 0 to approximately 4. The rate of decrease slows significantly after `α ≈ 4`, approaching an asymptotic value near `ε^opt ≈ 0.02` by `α = 8`. The vertical error bars indicate uncertainty or variance in the `ε^opt` measurement at each `α` value; the bars appear relatively consistent in size across the range.
**Left Panel Specifics:**
* The **green dashed line** at `ε^opt = 0.3` serves as a baseline or upper bound, matching the starting point of the primary series.
* The **magenta dotted line** at `ε^opt ≈ 0.24` may represent an alternative benchmark or threshold.
* The **green dotted line** diverging above the primary series suggests a different model or condition that performs worse (higher `ε^opt`) as `α` increases.
* The **inset graph** provides a zoomed or normalized view. The red and black lines within it both decrease in a step-function manner as `α/L` increases from 0 to 4. The red line is consistently above the black line. The y-values in the inset range from ~0.3 down to ~0.05.
**Right Panel Specifics:**
This panel is a cleaner presentation of the primary result. It contains only the primary green series and the legend identifying it as `informative HMC`. The horizontal green dashed line at `ε^opt = 0.3` is also present.
### Key Observations
1. **Strong Inverse Relationship:** There is a strong, non-linear inverse relationship between `α` and `ε^opt`. Increasing `α` leads to a lower optimal error `ε^opt`.
2. **Diminishing Returns:** The benefit of increasing `α` diminishes after `α ≈ 4`, where the curve flattens.
3. **Consistency:** The primary trend is identical in both panels, confirming the robustness of the result.
4. **Benchmark Comparison:** The left panel contextualizes the primary result against two other benchmarks (dashed and dotted lines), showing the `informative HMC` method (solid line) outperforms them for all `α > 0`.
5. **Inset Discrepancy:** The stepwise behavior in the inset graph contrasts with the smooth curve of the main plot, suggesting it may depict a different metric, a theoretical bound, or results from a discrete approximation.
### Interpretation
This figure likely comes from a study on optimization, sampling, or machine learning, comparing the performance of a method called "informative HMC" (Hamiltonian Monte Carlo) against other approaches. The parameter `α` could represent a regularization strength, a step size, or a measure of information content.
* **What the data suggests:** The "informative HMC" method's performance (`ε^opt`) improves significantly as the parameter `α` is increased, but this improvement saturates. It consistently outperforms the benchmarks represented by the dashed and dotted lines.
* **How elements relate:** The main plot shows the empirical performance curve. The inset likely provides a related theoretical or normalized view. The horizontal lines establish reference points for maximum error and a potential alternative method's performance.
* **Notable anomalies:** The stepwise decrease in the inset is the most striking anomaly compared to the smooth main curve. This could indicate a phase transition, a change in active constraints, or an artifact of the method used to generate the inset data. The consistent error bars on the main series suggest stable variance in the measurements.
**Language Declaration:** All text in the image is in English.