## Line Chart: AURC vs. Number Explanations
### Overview
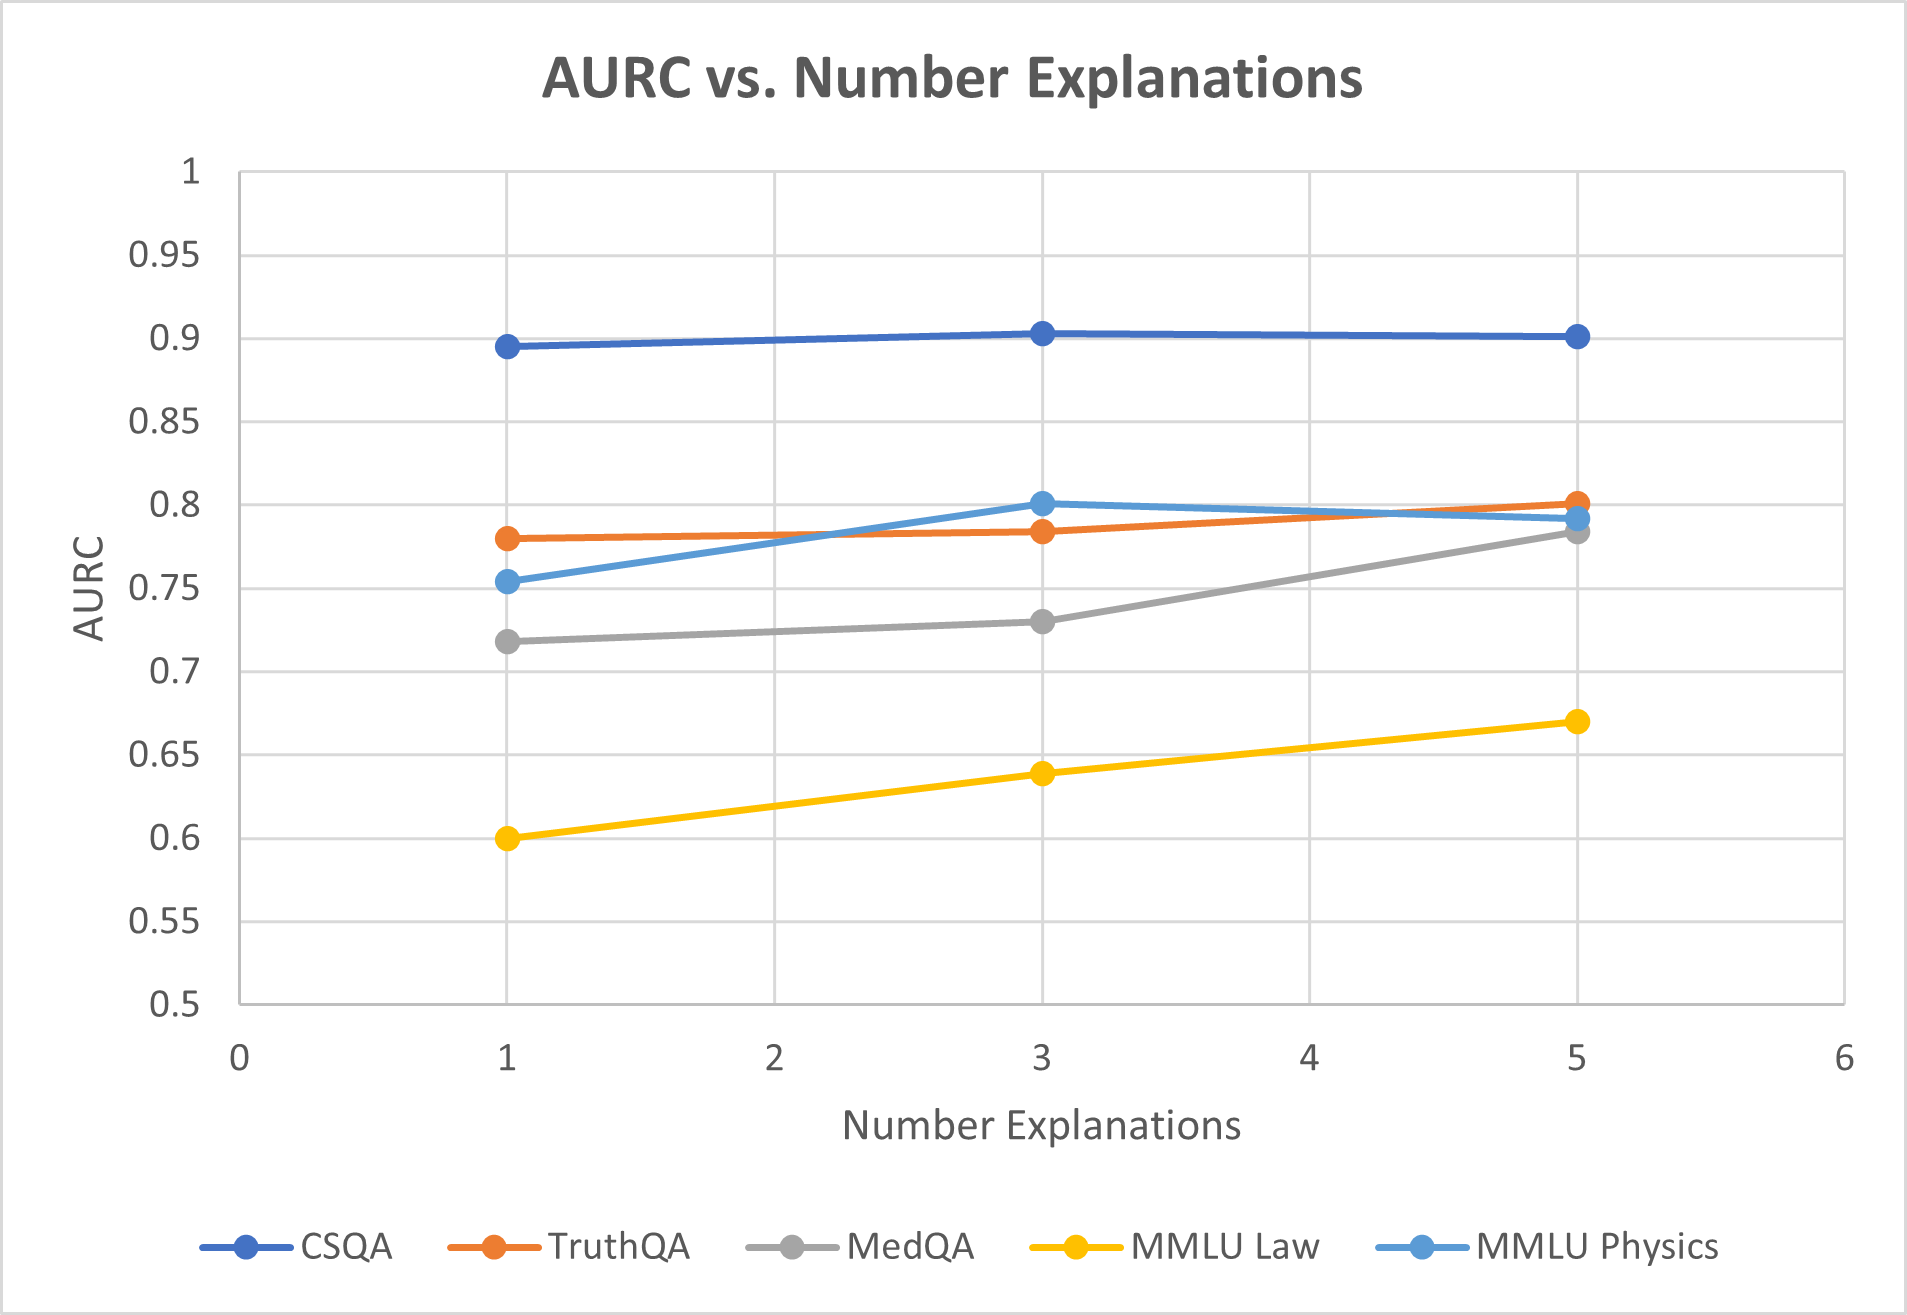
This is a line chart titled "AURC vs. Number Explanations." It plots the performance metric "AURC" (likely Area Under the Risk-Coverage curve, a metric for evaluating model confidence or selective prediction) against the "Number Explanations" provided. The chart compares the performance of five different question-answering or reasoning datasets: CSQA, TruthQA, MedQA, MMLU Law, and MMLU Physics.
### Components/Axes
* **Title:** "AURC vs. Number Explanations" (centered at the top).
* **Y-Axis:**
* **Label:** "AURC" (vertical text on the left).
* **Scale:** Linear scale from 0.5 to 1.0, with major gridlines and labels at intervals of 0.05 (0.5, 0.55, 0.6, 0.65, 0.7, 0.75, 0.8, 0.85, 0.9, 0.95, 1).
* **X-Axis:**
* **Label:** "Number Explanations" (horizontal text at the bottom).
* **Scale:** Linear scale from 0 to 6, with major gridlines and labels at integer intervals (0, 1, 2, 3, 4, 5, 6).
* **Legend:** Positioned at the bottom center of the chart. It contains five entries, each with a colored line segment and a circular marker:
* **Dark Blue Line & Marker:** CSQA
* **Orange Line & Marker:** TruthQA
* **Gray Line & Marker:** MedQA
* **Yellow Line & Marker:** MMLU Law
* **Light Blue Line & Marker:** MMLU Physics
* **Grid:** A light gray grid is present for both the x and y axes.
### Detailed Analysis
The chart displays data points at x-values of 1, 3, and 5 for each series. The approximate y-values (AURC) for each data point are as follows:
**1. CSQA (Dark Blue Line):**
* **Trend:** The line is nearly horizontal, showing very stable performance.
* **Data Points:**
* At x=1: y ≈ 0.895
* At x=3: y ≈ 0.90
* At x=5: y ≈ 0.90
**2. TruthQA (Orange Line):**
* **Trend:** The line shows a very slight upward slope, indicating minimal improvement.
* **Data Points:**
* At x=1: y ≈ 0.78
* At x=3: y ≈ 0.785
* At x=5: y ≈ 0.80
**3. MedQA (Gray Line):**
* **Trend:** The line shows a clear upward slope, indicating improvement with more explanations.
* **Data Points:**
* At x=1: y ≈ 0.72
* At x=3: y ≈ 0.73
* At x=5: y ≈ 0.78
**4. MMLU Law (Yellow Line):**
* **Trend:** The line shows a steady, consistent upward slope, indicating the most pronounced improvement among the series.
* **Data Points:**
* At x=1: y ≈ 0.60
* At x=3: y ≈ 0.64
* At x=5: y ≈ 0.67
**5. MMLU Physics (Light Blue Line):**
* **Trend:** The line increases from 1 to 3 explanations, then shows a slight decrease from 3 to 5 explanations.
* **Data Points:**
* At x=1: y ≈ 0.755
* At x=3: y ≈ 0.80
* At x=5: y ≈ 0.79
### Key Observations
1. **Performance Hierarchy:** CSQA consistently achieves the highest AURC (~0.90), followed by TruthQA and MMLU Physics in the 0.75-0.80 range, then MedQA (0.72-0.78), with MMLU Law having the lowest AURC (0.60-0.67).
2. **Impact of Explanations:** For four out of five datasets (all except CSQA), increasing the number of explanations from 1 to 5 is associated with an increase in AURC (improved performance). The magnitude of this improvement varies.
3. **Diminishing Returns/Plateau:** CSQA shows almost no change, suggesting its performance is already near a ceiling with just one explanation. MMLU Physics shows a potential peak at 3 explanations.
4. **Greatest Improver:** MMLU Law shows the largest absolute gain in AURC (~0.07) and the steepest slope, indicating it benefits the most from additional explanations within the tested range.
5. **Crossover:** At 1 explanation, MMLU Physics (light blue) outperforms TruthQA (orange). By 3 explanations, they are nearly equal, and by 5 explanations, TruthQA slightly surpasses MMLU Physics.
### Interpretation
The chart suggests a positive correlation between the number of explanations provided and the AURC performance for most of the evaluated reasoning tasks. This implies that allowing a model to generate or consider multiple explanations can improve its reliability or calibration (as measured by AURC) on these benchmarks.
The varying slopes indicate that the benefit is task-dependent. Tasks like MMLU Law and MedQA, which may involve more complex or specialized reasoning, show a stronger positive response to additional explanations. In contrast, CSQA, which might be a more straightforward commonsense reasoning task, appears robust with minimal explanation. The slight dip for MMLU Physics after 3 explanations could indicate noise, overfitting, or a point where additional explanations introduce confusion rather than clarity for that specific domain.
Overall, the data supports the hypothesis that leveraging multiple explanations is a viable strategy for enhancing the performance of question-answering systems, particularly for tasks where initial performance is lower.