## Line Chart: AURC vs. Number Explanations
### Overview
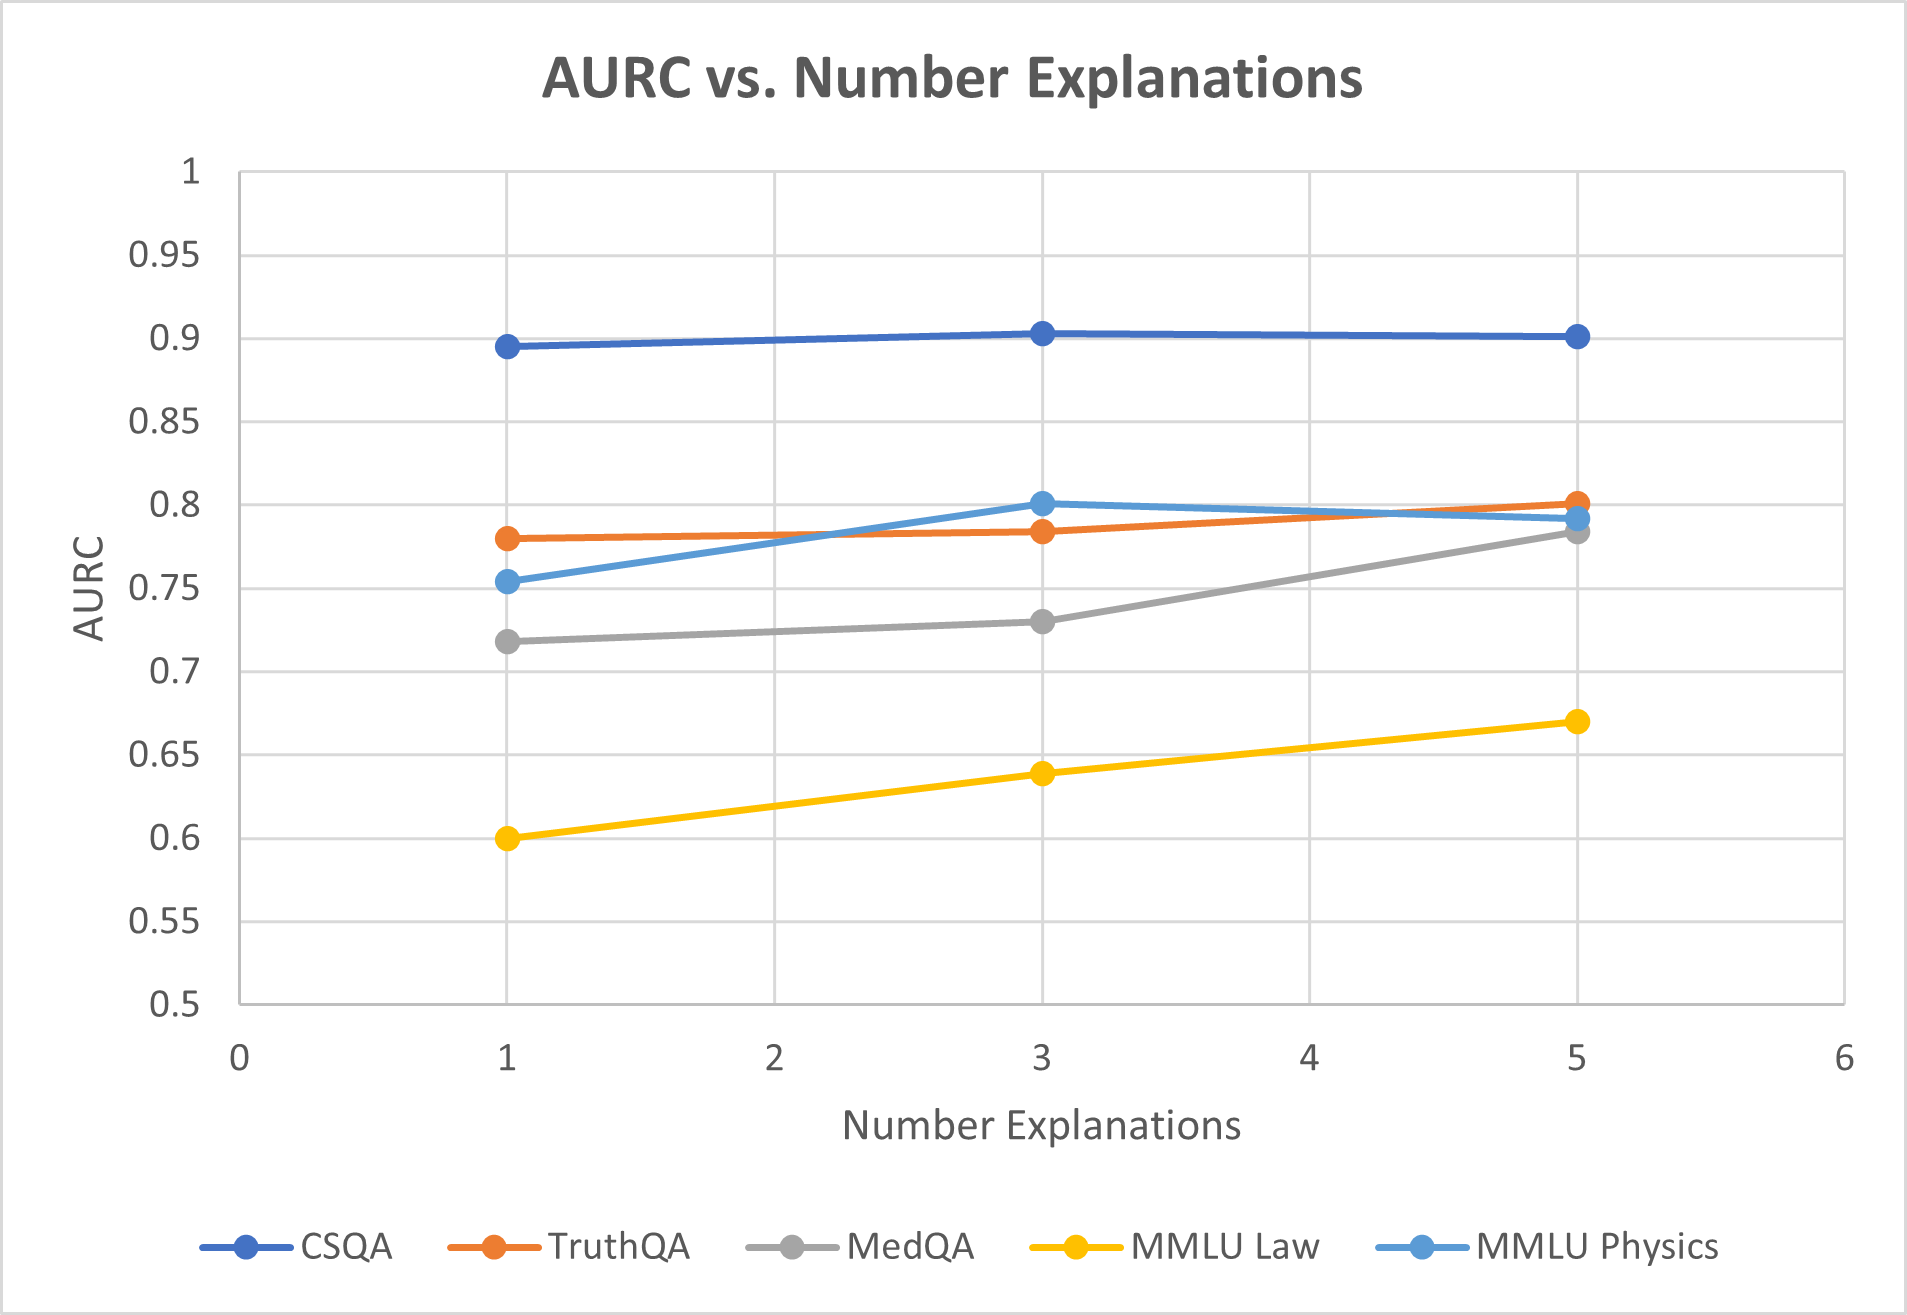
The chart compares the performance of five systems (CSQA, TruthQA, MedQA, MMLU Law, MMLU Physics) across different numbers of explanations (1, 3, 5) using the metric AURC (Area Under the ROC Curve). The y-axis ranges from 0.5 to 1, and the x-axis spans 0 to 6 explanations. Data points are plotted at x=1, 3, and 5.
### Components/Axes
- **X-axis**: "Number Explanations" (0–6, integer increments).
- **Y-axis**: "AURC" (0.5–1, 0.05 increments).
- **Legend**: Located at the bottom, mapping colors to systems:
- Blue: CSQA
- Orange: TruthQA
- Gray: MedQA
- Yellow: MMLU Law
- Light Blue: MMLU Physics
### Detailed Analysis
1. **CSQA (Blue)**:
- Values: ~0.9 at x=1, 3, and 5.
- Trend: Flat line, indicating consistent performance across all explanation counts.
2. **TruthQA (Orange)**:
- Values: ~0.78 at x=1, 0.78 at x=3, ~0.8 at x=5.
- Trend: Slight upward slope, improving marginally with more explanations.
3. **MedQA (Gray)**:
- Values: ~0.72 at x=1, ~0.75 at x=3, ~0.78 at x=5.
- Trend: Steady upward trajectory, showing the most improvement with explanations.
4. **MMLU Law (Yellow)**:
- Values: ~0.6 at x=1, ~0.65 at x=3, ~0.67 at x=5.
- Trend: Gradual increase, but remains the lowest-performing system.
5. **MMLU Physics (Light Blue)**:
- Values: ~0.75 at x=1, ~0.8 at x=3, ~0.79 at x=5.
- Trend: Peaks at x=3, then declines slightly.
### Key Observations
- **CSQA** maintains the highest AURC (~0.9) across all explanation counts, suggesting robustness.
- **MMLU Law** consistently underperforms, with the lowest AURC (~0.6–0.67).
- **MMLU Physics** shows a non-linear trend, peaking at x=3 before declining.
- **MedQA** demonstrates the most significant improvement with explanations (+0.06 from x=1 to x=5).
### Interpretation
The data suggests that **CSQA** is the most reliable system, maintaining high performance regardless of explanation count. **MedQA** benefits most from additional explanations, indicating potential for optimization. **MMLU Physics**' peak at x=3 implies an optimal explanation threshold, while its decline at x=5 may reflect overfitting or noise. **MMLU Law**'s consistent low performance highlights systemic limitations. The trends emphasize that explanation count does not universally improve AURC, with system-specific dynamics at play.