## Comparative Pie Charts: Error Distributions for Two AI Models
### Overview
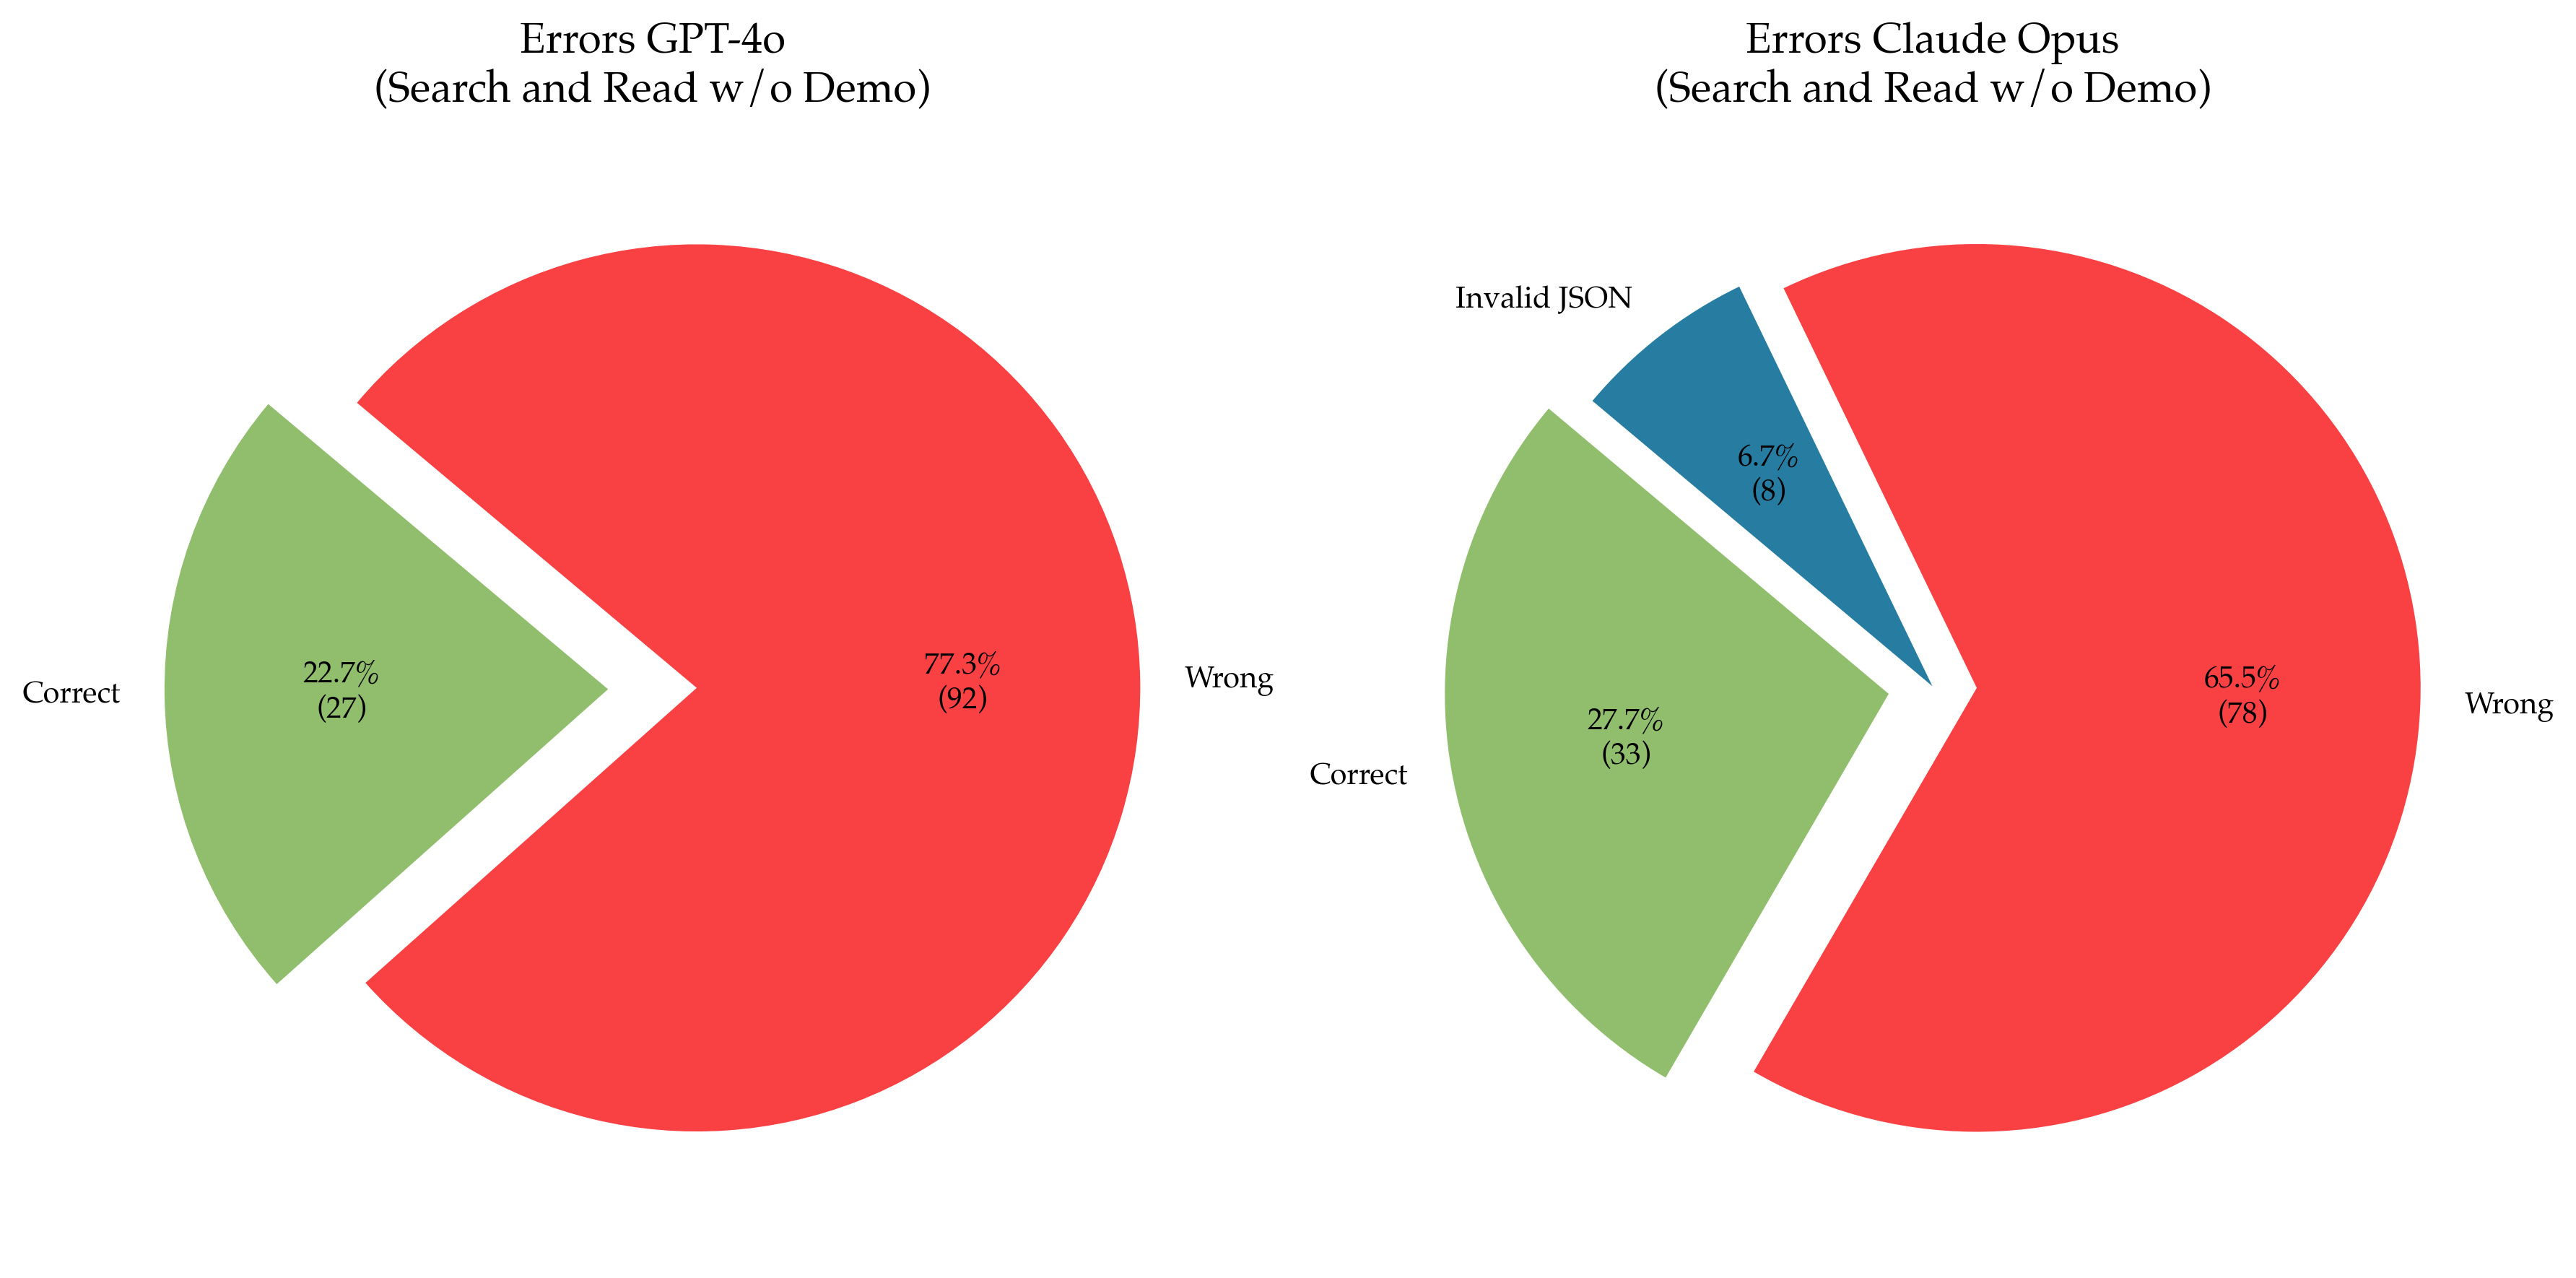
The image displays two pie charts side-by-side, comparing the error distributions of two AI models, "GPT-4o" and "Claude Opus," on a task labeled "Search and Read w/o Demo." The charts visualize the proportion of "Correct," "Wrong," and (for Claude Opus) "Invalid JSON" outcomes. The language present in the image is English.
### Components/Axes
* **Chart Type:** Two exploded pie charts.
* **Titles:**
* Left Chart: "Errors GPT-4o (Search and Read w/o Demo)"
* Right Chart: "Errors Claude Opus (Search and Read w/o Demo)"
* **Categories & Legend (Color Mapping):**
* **Green Segment:** Labeled "Correct".
* **Red Segment:** Labeled "Wrong".
* **Blue Segment (Right Chart only):** Labeled "Invalid JSON".
* **Data Labels:** Each segment contains a percentage and an absolute count in parentheses.
* **Spatial Layout:** The two charts are positioned horizontally. In each chart, one segment is "exploded" (pulled away from the center) for emphasis.
### Detailed Analysis
**Left Chart: Errors GPT-4o**
* **Correct (Green):** Positioned on the left side of the pie, exploded outward. Represents **22.7%** of outcomes, with an absolute count of **(27)**.
* **Wrong (Red):** Positioned on the right side of the pie. Represents **77.3%** of outcomes, with an absolute count of **(92)**.
* **Total Count:** 27 + 92 = 119.
**Right Chart: Errors Claude Opus**
* **Correct (Green):** Positioned on the left side of the pie. Represents **27.7%** of outcomes, with an absolute count of **(33)**.
* **Invalid JSON (Blue):** Positioned at the top of the pie, exploded outward. Represents **6.7%** of outcomes, with an absolute count of **(8)**.
* **Wrong (Red):** Positioned on the right side of the pie. Represents **65.5%** of outcomes, with an absolute count of **(78)**.
* **Total Count:** 33 + 8 + 78 = 119.
### Key Observations
1. **Primary Error Type:** For both models, the "Wrong" category (red) constitutes the majority of outcomes, indicating that incorrect responses are the most common failure mode.
2. **Model Comparison:**
* GPT-4o has a higher percentage of "Wrong" outcomes (77.3%) compared to Claude Opus (65.5%).
* Claude Opus has a slightly higher percentage of "Correct" outcomes (27.7%) compared to GPT-4o (22.7%).
* Claude Opus exhibits a distinct error category, "Invalid JSON" (6.7%), which is not present in the GPT-4o chart.
3. **Visual Emphasis:** The "Correct" segment is exploded in the GPT-4o chart, while the "Invalid JSON" segment is exploded in the Claude Opus chart. This may draw attention to the positive outcome for the first model and a specific, novel error type for the second.
### Interpretation
The data suggests a comparative performance analysis on a specific task ("Search and Read w/o Demo"). The high prevalence of "Wrong" answers for both models indicates this task is challenging, with error rates exceeding 65% in both cases.
The key differentiator is the *type* of error. GPT-4o's errors are binary (correct vs. wrong), whereas Claude Opus introduces a third category: structural failure in output formatting ("Invalid JSON"). This implies that while Claude Opus may have a marginally better raw accuracy rate, it is susceptible to a specific technical failure mode not observed with GPT-4o in this test. Conversely, GPT-4o appears more consistent in its output format, even when the content is incorrect.
The total sample size (119 trials per model) is identical, allowing for a direct comparison of proportions. The results highlight that model evaluation should consider not only the rate of correct answers but also the taxonomy and nature of failures, as different models may exhibit distinct error profiles. The "Invalid JSON" error for Claude Opus could be critical in applications requiring strict structured data output.