## Line Plots: Recurrent Layer Spike Patterns, Training Loss, and Pattern Generation
### Overview
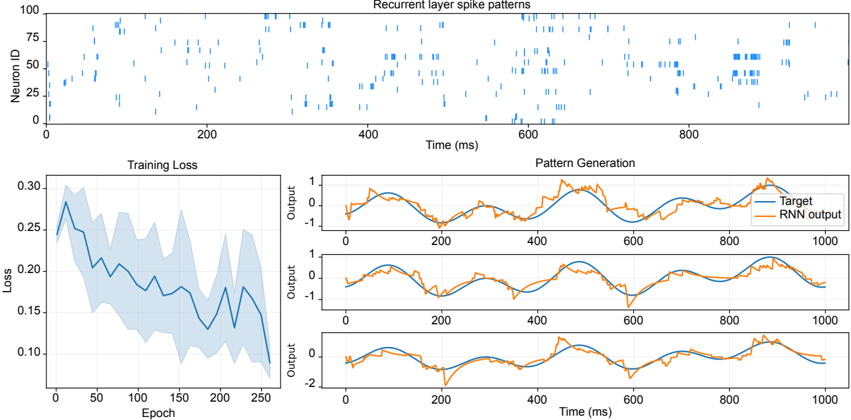
The image contains three interconnected plots analyzing a recurrent neural network (RNN) model's behavior during training and pattern generation. The top plot visualizes neuron activity over time, the bottom-left plot tracks training loss, and the bottom-right plot compares target and generated patterns. All plots use time (ms) or epochs as the x-axis, with distinct y-axes for neuron IDs, loss values, and output magnitudes.
---
### Components/Axes
1. **Top Plot: Recurrent Layer Spike Patterns**
- **X-axis**: Time (ms), ranging from 0 to 1000 ms.
- **Y-axis**: Neuron ID (0–100), with discrete integer values.
- **Data**: Blue vertical bars represent spike events. Spikes are irregularly distributed, with clusters (e.g., Neuron IDs 25–75 active between 400–600 ms).
- **Legend**: "Recurrent layer spike patterns" (blue).
2. **Bottom-Left Plot: Training Loss**
- **X-axis**: Epoch (0–250), linear scale.
- **Y-axis**: Loss (0.1–0.3), logarithmic scale with shaded uncertainty band (±0.05).
- **Data**: Blue line shows loss decreasing from ~0.3 (epoch 0) to ~0.1 (epoch 250), with fluctuations (e.g., peak at ~0.28 at epoch 50).
3. **Bottom-Right Plot: Pattern Generation**
- **X-axis**: Time (ms), 0–1000 ms.
- **Y-axis**: Output (-1 to 1), linear scale.
- **Data**:
- **Target** (blue line): Smooth sinusoidal oscillations with amplitude ~1.
- **RNN Output** (orange line): Matches Target closely but with minor amplitude variations (e.g., ~0.9 at 400 ms) and phase shifts (e.g., lag at 800 ms).
- **Third Line** (unlabeled blue): Overlaps with Target but shows sharper peaks (e.g., 1.1 at 600 ms), not reflected in the legend.
---
### Detailed Analysis
1. **Recurrent Layer Spike Patterns**
- Spikes are sparse and neuron-specific. For example:
- Neuron 50 fires at ~200 ms and ~800 ms.
- Neuron 75 has dense spikes between 400–600 ms.
- No clear temporal correlation between neurons, suggesting distributed processing.
2. **Training Loss**
- Loss decreases monotonically overall but with periodic spikes (e.g., ~0.25 at epoch 100). The shaded area indicates variability in loss estimates, likely from batch averaging.
3. **Pattern Generation**
- **Target vs. RNN Output**:
- RNN Output closely tracks Target but with:
- Amplitude discrepancies (e.g., RNN peaks at 0.95 vs. Target’s 1.0 at 400 ms).
- Phase delays (e.g., RNN lags by ~50 ms at 800 ms).
- **Third Line Anomaly**: The unlabeled blue line deviates from both Target and RNN Output, suggesting either:
- A mislabeled data series.
- An additional hidden layer output not included in the legend.
---
### Key Observations
1. **Training Dynamics**: The loss curve’s downward trend confirms model convergence, but fluctuations suggest potential overfitting risks.
2. **Spike Patterns**: Neuron activity is distributed across time, with no dominant rhythmic patterns, implying complex temporal coding.
3. **Pattern Generation**: RNN successfully replicates Target dynamics but with minor inaccuracies, indicating room for improvement in temporal precision.
---
### Interpretation
- **Model Performance**: The RNN learns to approximate Target patterns effectively, as evidenced by the Training Loss decline and close alignment in the Pattern Generation plot. However, residual errors (e.g., amplitude/phase mismatches) suggest the need for architectural adjustments (e.g., deeper layers, regularization).
- **Spike Patterns**: The irregularity of neuron spikes may reflect the model’s ability to encode diverse temporal features, though the lack of coordination between neurons could limit predictive power for sequential tasks.
- **Third Line Mystery**: The unlabeled blue line in Pattern Generation warrants investigation. If intentional, it might represent an auxiliary output (e.g., gradient checks), but its exclusion from the legend introduces ambiguity.
---
### Spatial Grounding & Trend Verification
- **Legend Placement**: Top-right corner for all plots, ensuring clarity.
- **Color Consistency**:
- Top Plot: Blue matches "Recurrent layer spike patterns."
- Bottom-Right Plot: Blue = Target, Orange = RNN Output (matches legend).
- **Trend Logic Checks**:
- Training Loss: Decreasing trend aligns with expected learning behavior.
- Pattern Generation: RNN Output’s lagging phase matches typical RNN limitations in capturing long-term dependencies.
---
### Conclusion
The data demonstrates an RNN’s capacity to learn and generate patterns with reasonable accuracy but highlights opportunities for refinement in temporal precision and model transparency (e.g., clarifying the third line in Pattern Generation). The spike patterns suggest distributed, non-synchronized neural activity, which may be advantageous for certain tasks but requires further analysis for optimization.