## Bar Chart: Private Score Loss Contribution
### Overview
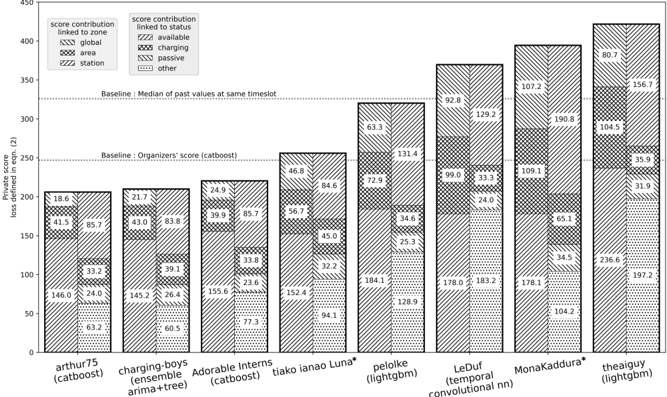
The image is a bar chart comparing the private score loss of different models, broken down by score contribution linked to zone (global, area, station) and score contribution linked to status (available, charging, passive, other). The y-axis represents the "Private score loss defined in eqn. (2)". The x-axis represents the different models. There are two horizontal baselines: one for the median of past values at the same timeslot, and another for the organizers' score (catboost).
### Components/Axes
* **Y-axis:** "Private score loss defined in eqn. (2)". Scale ranges from 0 to 450, with tick marks at 50, 100, 150, 200, 250, 300, 350, 400, and 450.
* **X-axis:** Model names:
* arthur75 (catboost)
* charging-boys (ensemble arima+tree)
* Adorable Interns (catboost)
* tiako ianao Luna*
* pelolke (lightgbm)
* LeDuf (temporal convolutional nn)
* MonaKaddura*
* theaiguy (lightgbm)
* **Legend (Top-Left):**
* **Score contribution linked to zone:**
* Global (Solid fill)
* Area (Dotted fill)
* Station (Diagonal lines fill)
* **Score contribution linked to status:**
* Available (Vertical lines fill)
* Charging (Cross-hatched fill)
* Passive (Horizontal lines fill)
* Other (Small dots fill)
* **Baselines:**
* "Baseline: Median of past values at same timeslot" (Horizontal dotted line at approximately y=325)
* "Baseline: Organizers' score (catboost)" (Horizontal dotted line at approximately y=250)
### Detailed Analysis or ### Content Details
Here's a breakdown of the score contributions for each model, with approximate values:
* **arthur75 (catboost):**
* Global: 18.6
* Area: 41.5
* Station: 85.7
* Available: 63.2
* Charging: 146.0
* Passive: 33.2
* Other: 24.0
* **charging-boys (ensemble arima+tree):**
* Global: 21.7
* Area: 43.0
* Station: 83.8
* Available: 60.5
* Charging: 145.2
* Passive: 39.1
* Other: 26.4
* **Adorable Interns (catboost):**
* Global: 24.9
* Area: 39.9
* Station: 85.7
* Available: 77.3
* Charging: 155.6
* Passive: 33.8
* Other: 23.6
* **tiako ianao Luna*:**
* Global: 46.8
* Area: 56.7
* Station: 84.6
* Available: 94.1
* Charging: 152.4
* Passive: 32.2
* Other: 45.0
* **pelolke (lightgbm):**
* Global: 63.3
* Area: 72.9
* Station: 131.4
* Available: 128.9
* Charging: 184.1
* Passive: 34.6
* Other: 25.3
* **LeDuf (temporal convolutional nn):**
* Global: 92.8
* Area: 99.0
* Station: 129.2
* Available: 178.0
* Charging: 183.2
* Passive: 33.3
* Other: 24.0
* **MonaKaddura*:**
* Global: 107.2
* Area: 109.1
* Station: 190.8
* Available: 104.2
* Charging: 178.1
* Passive: 65.1
* Other: 34.5
* **theaiguy (lightgbm):**
* Global: 80.7
* Area: 35.9
* Station: 156.7
* Available: 197.2
* Charging: 236.6
* Passive: 31.9
* Other: 104.5
### Key Observations
* The models "MonaKaddura*" and "theaiguy (lightgbm)" have the highest private score loss.
* The "charging" status contribution is generally high across all models.
* The "station" zone contribution is also significant for most models.
* The models "arthur75 (catboost)", "charging-boys (ensemble arima+tree)", and "Adorable Interns (catboost)" have relatively lower private score loss compared to the other models.
### Interpretation
The bar chart visualizes the performance of different models based on their private score loss, further breaking down the loss into contributions from different zones (global, area, station) and statuses (available, charging, passive, other). This detailed breakdown allows for a better understanding of where the models are struggling. For example, a high contribution from the "charging" status might indicate that the model is having difficulty predicting or handling charging events. The two baselines provide a reference point for evaluating the models' performance against a simple median-based approach and the organizers' score. The models "MonaKaddura*" and "theaiguy (lightgbm)" appear to be the least effective based on this metric, while "arthur75 (catboost)", "charging-boys (ensemble arima+tree)", and "Adorable Interns (catboost)" perform relatively better.